. 2018 Aug 9;7:e39879. doi: 10.7554/eLife.39879

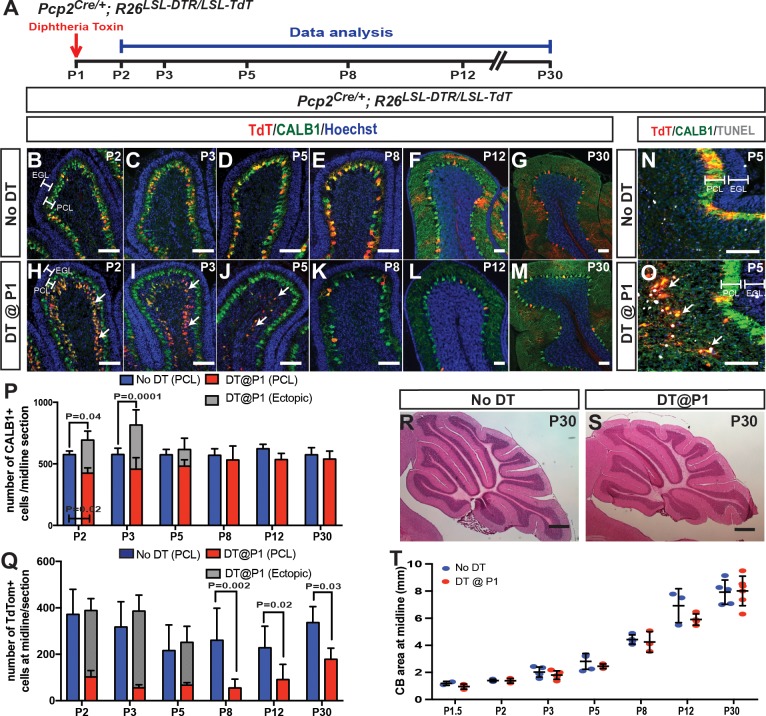
Figure 1. Ablation of PCs at P1 stimulates their replenishment and development of normal CB size and morphology.

(A) The experimental plan. (B–M) IF analysis at the indicated ages for TdT and CALB1 in sagittal cerebellar sections of lobule IV-V in No DT (B-G) and P1-PC-DTR mice (H-M). (N–O) Analysis of apoptosis at P5 using TUNEL. (P) Quantification of CALB1+ cells per midline section in PCL (blue or red) and ectopic layer (grey) (PCL cells: Two-way ANOVA F(5,54)=4.034, p=0.0035, and total number of PCs: Two-way ANOVA F(5,27)=4.732, p=0.003, n ≥ 3 animals/condition). (Q) Quantification of TdT+ cells per section (PCL cells: Two-way ANOVA F(5,48)=6.957, p=0.0001). Significant post hoc comparisons are shown. (R–S) H and E stained midline sagittal sections of cerebella at P30 of No DT (R) and P1-PC-DTR (S) mice. (T) Quantification of midline sagittal areas of cerebella shows no differences upon DT injection (p=0.89, n ≥ 3 for each age). Scale bars: (B–O) 200 μm, (R–S) 500 μm. (EGL: external granule layer, PCL: Purkinje cell layer).

Figure 1—source data 1. Summary of the antibodies used in the study.
DOI: 10.7554/eLife.39879.007
Figure 1—source data 2. Summary of the statistics performed.
DOI: 10.7554/eLife.39879.008

Figure 1.

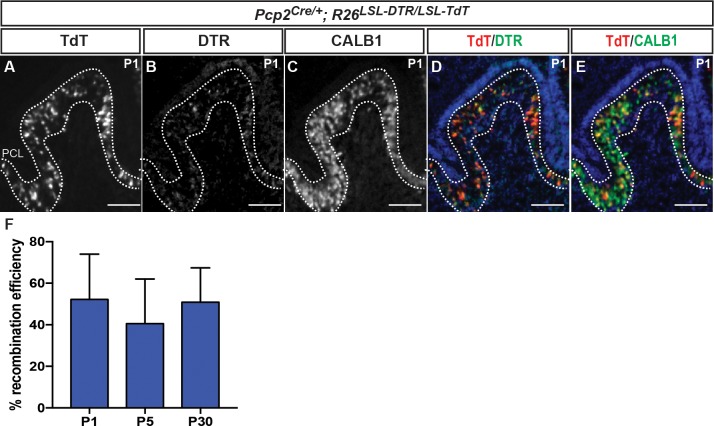
Figure 1—figure supplement 1. DTR and TdT are co-expressed in ~50% of PCs in PC-DTR mice at P1, P5 and P30.

Figure 1—figure supplement 1.

(A–E) IF analysis at P1 of the indicated proteins and combinations shows that all the TdT+ cells express DTR and CALB1. (F) Quantification of recombination efficiency in PCs (%TdT+ and CALB1+ cells over all CALB1+ cells) at P1, 5 and 30 shows no significant change (One-way ANOVA, F(2,9)=0.4341, p=0.66, n ≥ 3 animals/age). DTR: Diphtheria toxin receptor, PCL: Purkinje cell layer. Scale bar: 100 μm.

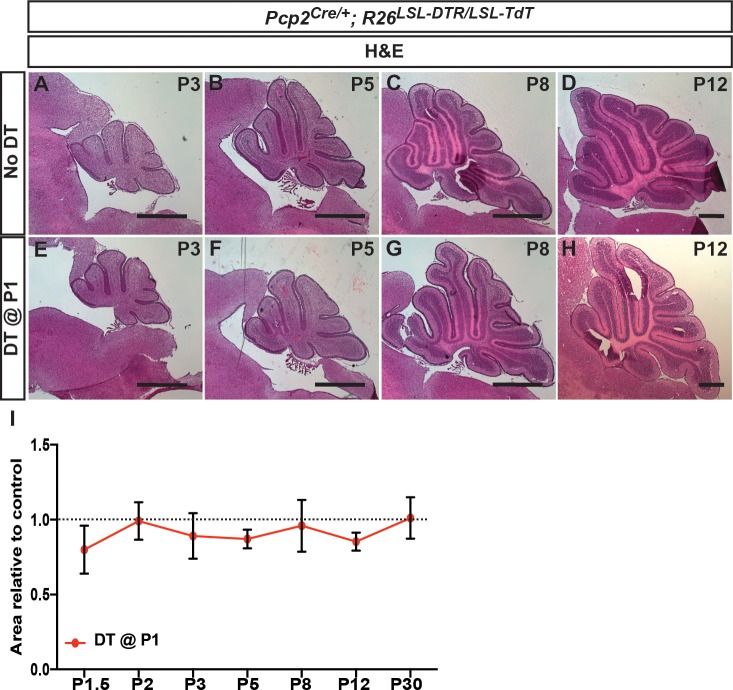
Figure 1—figure supplement 2. CB size and morphology appears normal following DT-mediated ablation of PCs at P1.

Figure 1—figure supplement 2.

(A–H) H and E stained midline sagittal sections of cerebella at the ages indicated for No DT (A-D) and P1-PC-DTR (E-H) mice. (I) Quantification of midline sagittal areas of cerebella shows no differences upon DT injection (n ≥ 3 for each age). Scale bars: 500 μm.

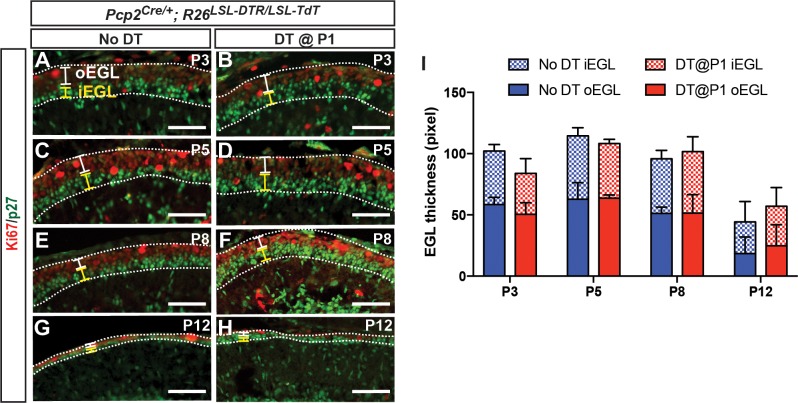
Figure 1—figure supplement 3. External granule cell layer thickness is not changed after DT-mediated killing of PCs at P1.

Figure 1—figure supplement 3.

(A–H). IF analysis of Ki67 (outer EGL, oEGL) and p27 (inner EGL, iEGL) in No DT (A, C, E, G) and P1-PC-DTR (B, D, F, H) animals at the indicated ages. (I) Quantification of the thickness (area/length) of the outer EGL (oEGL), which contains proliferating granule cell progenitors, and the inner EGL (iEGL), which contains the differentiating granule cells, reveals no significant differences in total EGL area and the ratio of inner and outer EGL areas between No DT and P1-PC-DTR animals (n = 3/condition) (p=0.85). EGL: external granule layer. Scale bars: 100 μm.