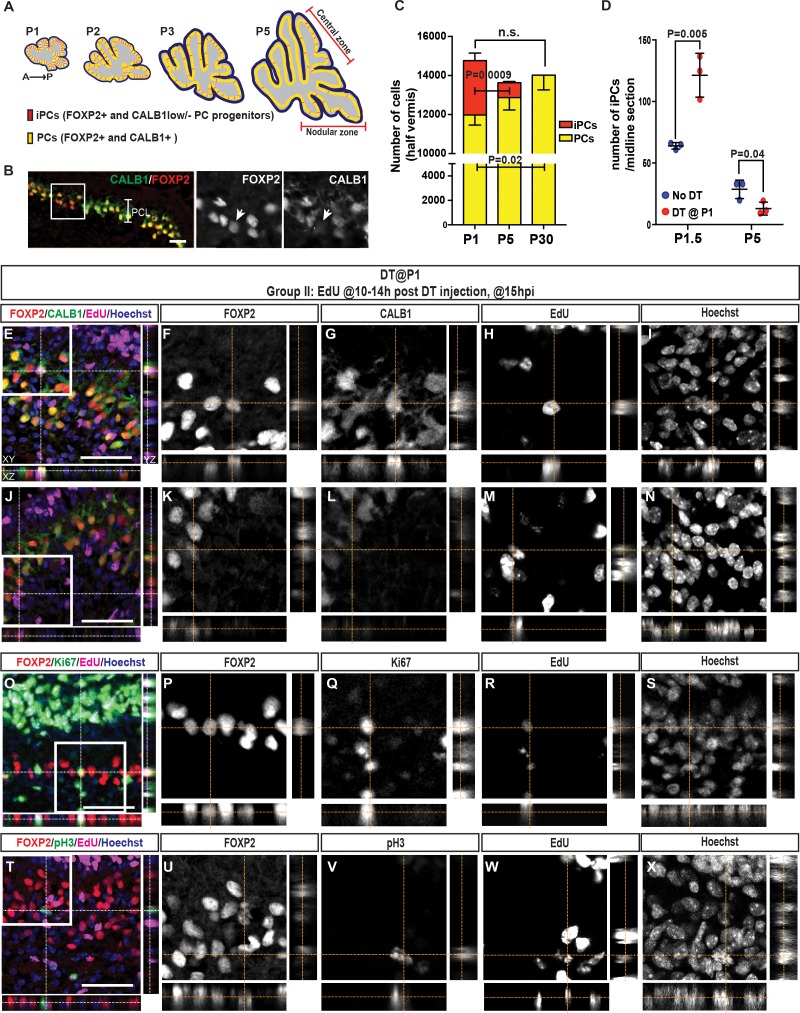
Figure 3. The number of iPCs diminishes with age and increases after ablation of PCs.
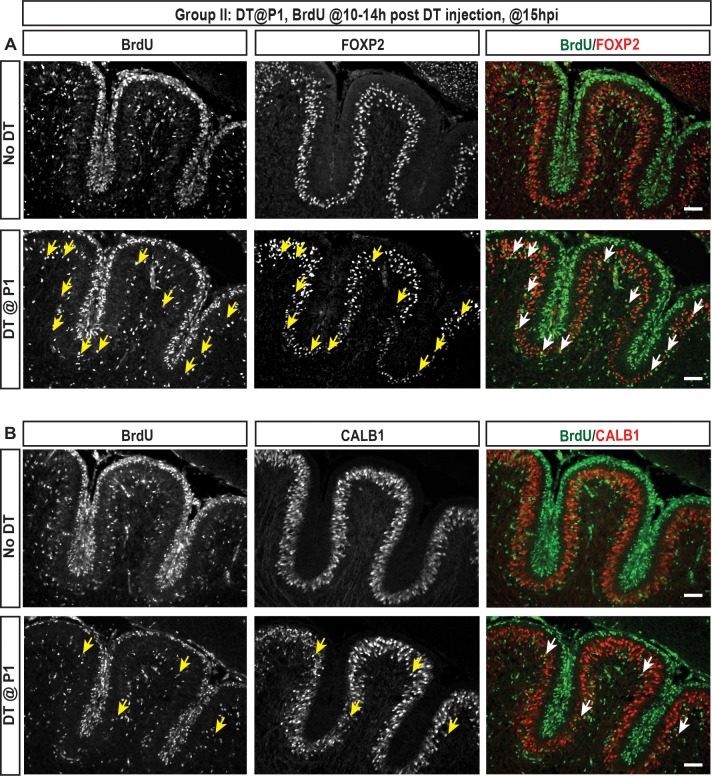
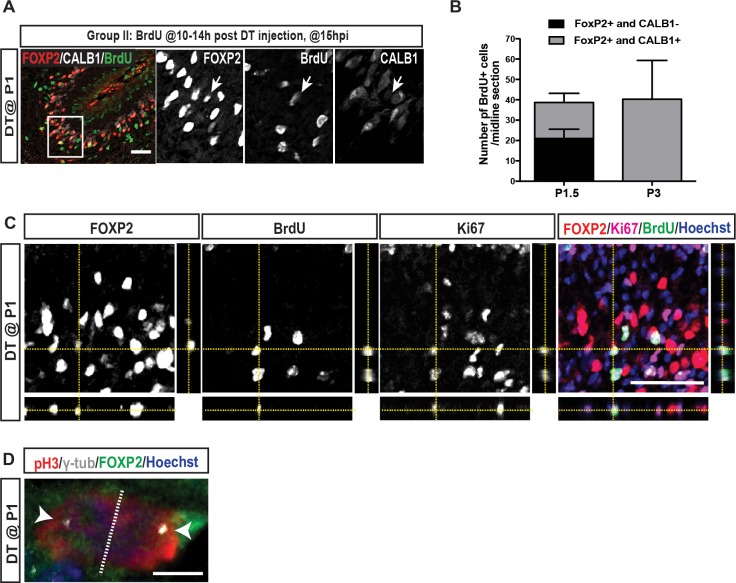
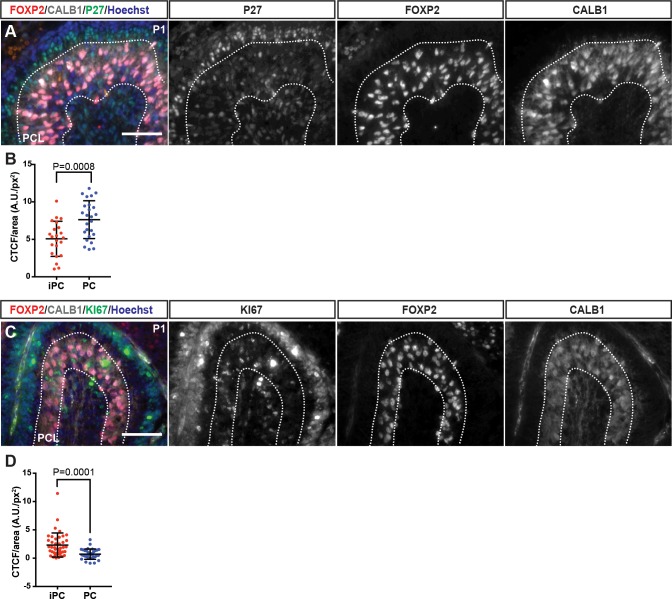
(A) Schematic representation of the distribution of iPCs (red) in sagittal midline sections of P1-5 cerebella (yellow, FoxP2+ and CALB1+ PCs) (B) IF analysis of iPCs (FoxP2+ and CALB1-/low, arrow) at P1.5 in No DT mice. (C) Quantification of the numbers of iPCs and PCs at P1, P5 and P30 (CALB1+: One-way ANOVA F(2.6) = 6.883, p=0.028, iPCs: Student’s t-test: p=0.0009, all cells: One-way ANOVA F(2.6) = 1.813, p=0.24, n = 3 animals/condition). Significant post hoc comparisons are shown. (D) Quantification of the numbers of iPCs at P1.5 (Two-tailed t-test, p=0.005, n = 3) and P5 (Two-tailed t-test, p=0.04, n = 3) in No DT and P1-PC-DTR mice. (E–N) Orthogonal projections of z-stack shows a EdU+ PC (CALB1+, FOXP2+) (E–I) or iPC (CALB1-/low, FOXP2+) (J–N) at 15 hr post injection (hpi) in P1-PC-DTR mice (n = 3). (O–X) Orthogonal projections of z-stack shows EdU+ and FOXP2+ cells that either express the cell cycle markers KI67 (O–S) or pH3 (T–X) at 15 hr post injection (hpi) in P1-PC-DTR mice (n = 3). Scale bars: (B) 100 μm, (E, J, O, T) 50 μm.
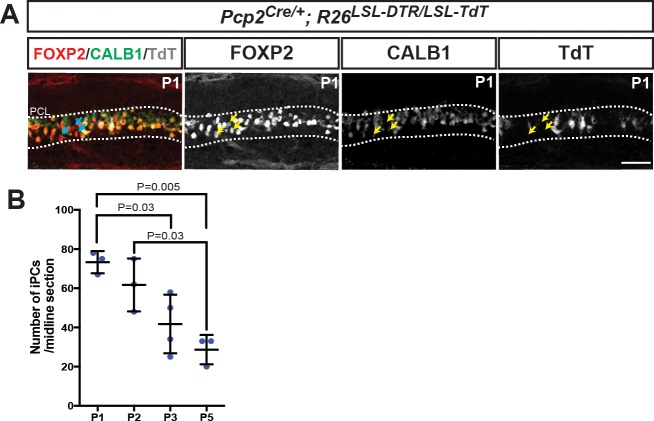
Figure 3—figure supplement 1. iPCs are not labeled by Pcp2Cre and their numbers diminish with age.
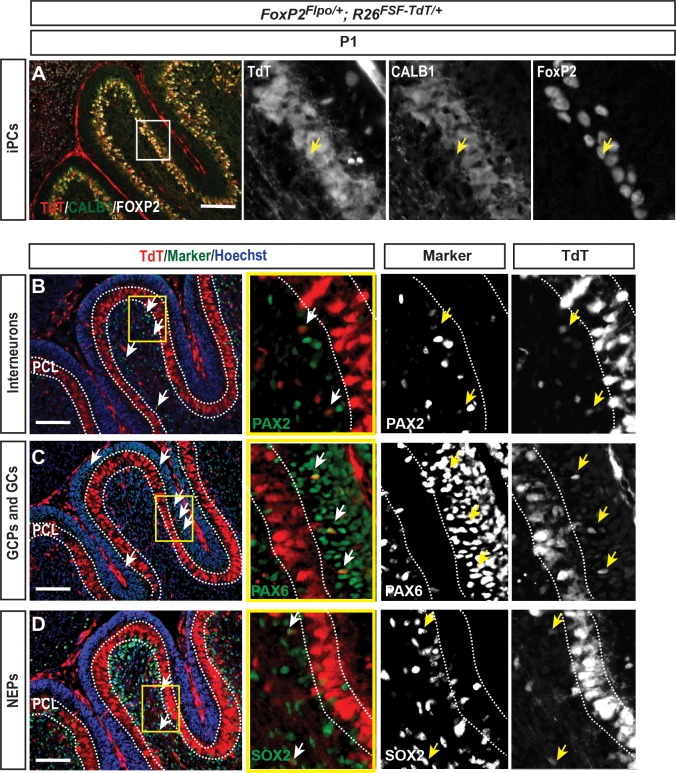
Figure 3—figure supplement 2. FoxP2-TdT fate mapping marks iPCs in the PCL at P1 as well as rare cells outsidethe PCL.
Figure 3—figure supplement 3. The number of FoxP2-TdT transiently marked iPCs increases 12 hr after DT injection at P1.
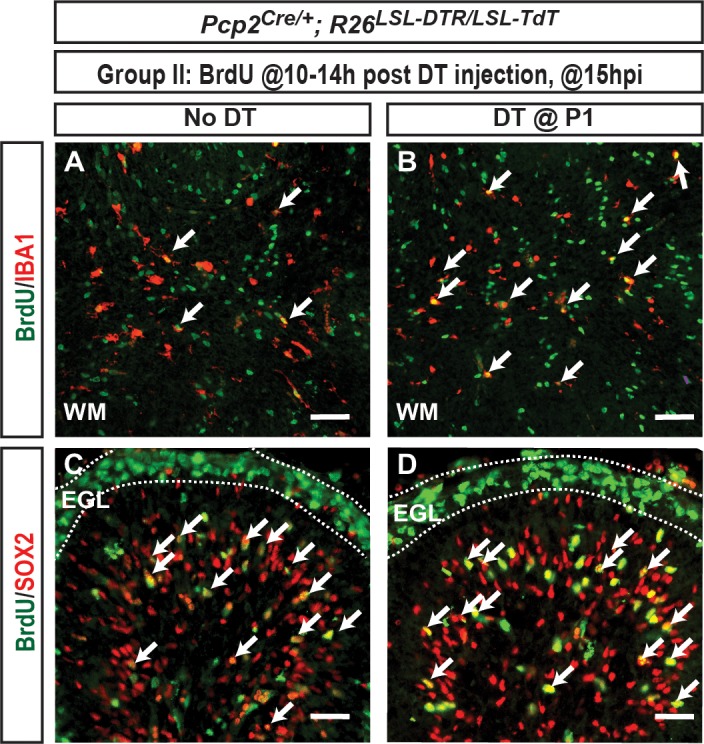
Figure 3—figure supplement 4. Microglia and glial progenitors proliferate in both No DT and DT P1-PC-DTR mice.
