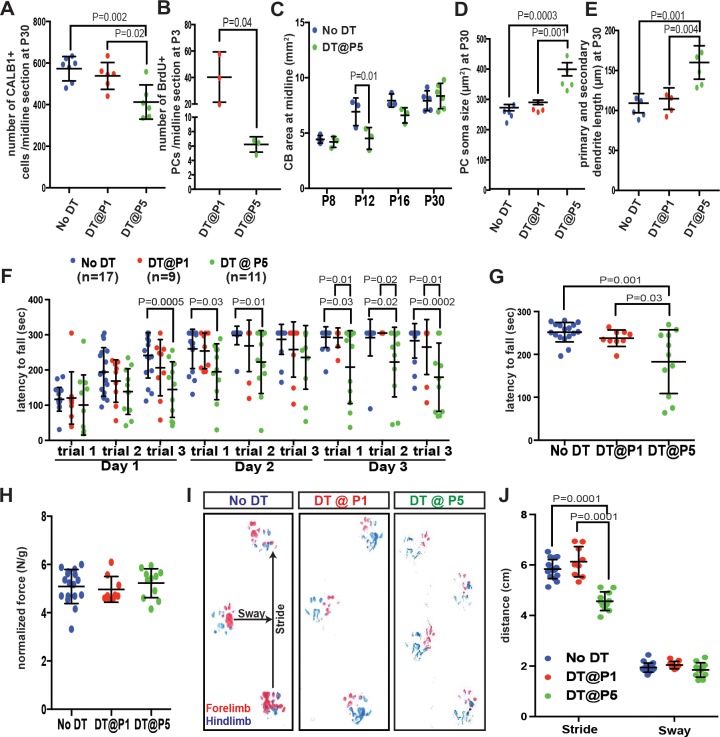
Figure 4. Despite the recovery of CB size, PCs are poorly replenished and motor behavior deficits develop when PCs are killed at P5 but not at P1.
(A) Number of CALB1+ cells at P30 (One-way ANOVA, F(2,16)=9.464, p=0.002, n ≥ 6). (B) Number of BrdU+ PCs 2 days post DT-injection in P1- or P5-PC-DTR mice (Two-tailed t-test, p=0.04). (C). Quantification of CB area in midline sagittal sections demonstrates that CB size is smaller at P12 in P5-PC-DTR mice but not later (Two-way ANOVA, F(1,22)=7.045, p=0.01, n ≥ 3). (D–E) PC soma size (D, One-way ANOVA, F(2.11) = 20.56, p=0.0002, n ≥ 4) and primary and secondary dendrite lengths (E, One-way ANOVA, F(2,11)=14.54, p=0.0008, n ≥ 4) at P30 were increased in P5-PC-DTR animals compared to No DT and P1-PC-DTR animals. (F–G) Latency to fall from rotarod at each trial (F, Two-way ANOVA, F(2,34)=8.37, p=0.001, n ≥ 9) and cumulative analysis (G, One-way ANOVA, F(2,34)=11.12, p=0.0002, n ≥ 9, No DT vs. DT@P1: p=0.83) for P30 P5-PC-DTR animals compared to No DT and P1-PC-DTR animals. (H) Analysis of grip strength showed no change in P1 (n = 9, vs No DT: p=0.89) and P5 (n = 11, vs. No DT: p=0.84, vs. DT@P1: p=0.64) DT-injected mice compared to controls (No DT, n = 17). (I–J) Representative images (I) and quantification (J) of footprint analysis performed on P1- (vs. No DT: stride: p=0.10 and sway: p=0.90) and P5-PC-DTR mice and controls (Two-way ANOVA, F(2,133)=73.45, p=0.0001, n ≥ 9). Significant post hoc comparisons are shown.


