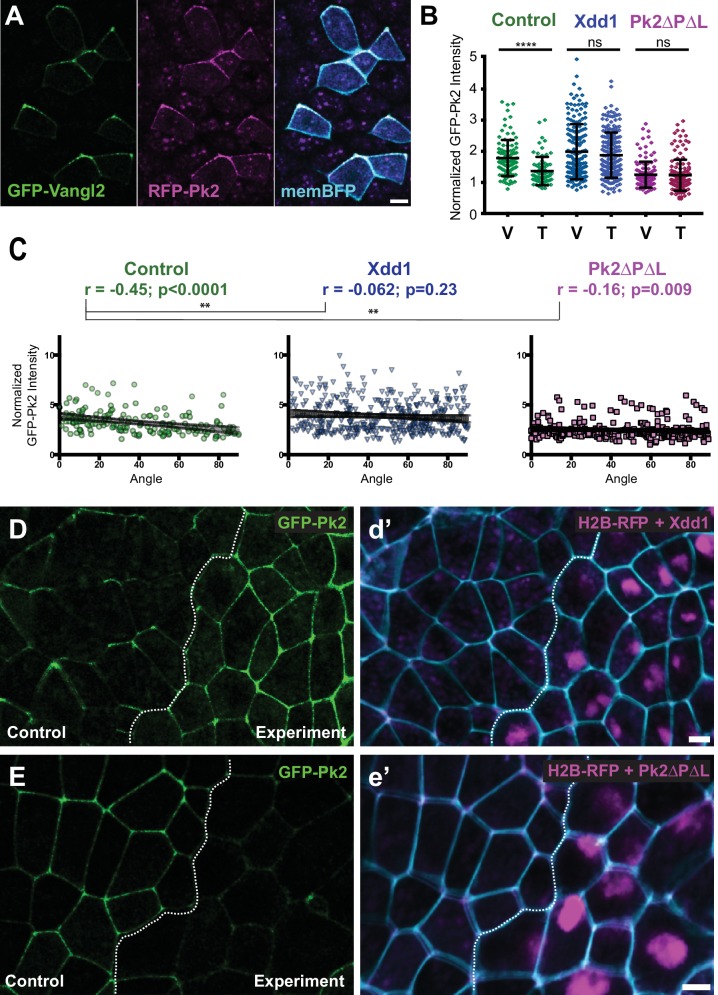
Figure 1. Planar polarized localization of Prickle2 and Vangl2 in the neural plate.
(A) Neural epithelium mosaically labeled with GFP-Vangl2, RFP-Pk2, and membraneBFP showing the overlapping localizations of Pk2 and Vangl2. Anterior is up, and scale = 10 µm. (B) Graph plotting GFP-Pk2 intensity along V-junctions (0–45° relative to mediolateral axis) and T-junctions (46–90° relative to mediolateral axis) normalized as a ratio to the mean cytoplasmic intensity in control cells and cells expressing Xdd1 and Pk2-ΔPΔL. Error bars represent standard deviation. Ctrl V vs. T, p<0.0001***; Xdd1 V vs. T, p=0.5799; Pk2-ΔPΔL V vs. T, p=0.173; Ctrl V vs. Xdd1 T, p=0.5770; Ctrl T vs. Pk2-ΔPΔL V, p=0.0268 (Mann Whitney test for significance). n = 101 V and 71 T from three experiments, seven embryos (Ctrl); n = n = 171 V and 199 T from four experiments, five embryos (Xdd1); n = 128 V and 142 T from three experiments, seven embryos (Pk2-ΔPΔL). (C) Distributions of data shown in (B) plotted against the angle of the junction at which the intensity was measured. Correlation coefficients for Xdd1 and Pk2-ΔPΔL were significantly different from controls using the Fischer R-to-Z transformation. n = 172 junctions (Control), n = 263 junctions (Xdd1) and n = 245 junctions (Pk2-ΔPΔL) (D-E) Confocal images of Xenopus neural epithelia labeled evenly with GFP-Pk2 and membraneBFP and mosaically with H2B-RFP, serving as a tracer for either Xdd1 (C) or Pk2-ΔPΔL (D) expression. Scale = 10 µm.
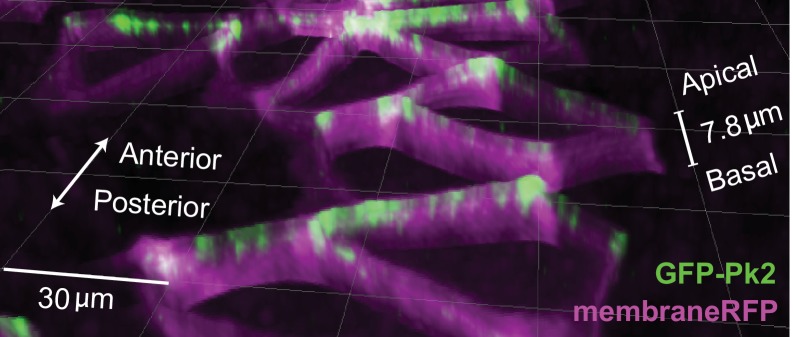
Figure 1—figure supplement 1. GFP-Pk2 localizes to anterior apicolateral regions of cells in the Xenopus neural plate.
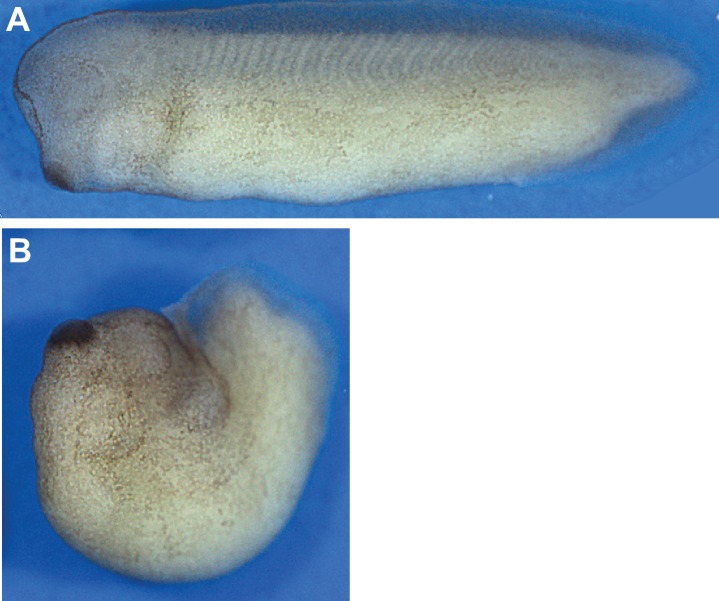
Figure 1—figure supplement 2. Pk2 knockdown results in embryonic convergent extension phenotypes.


