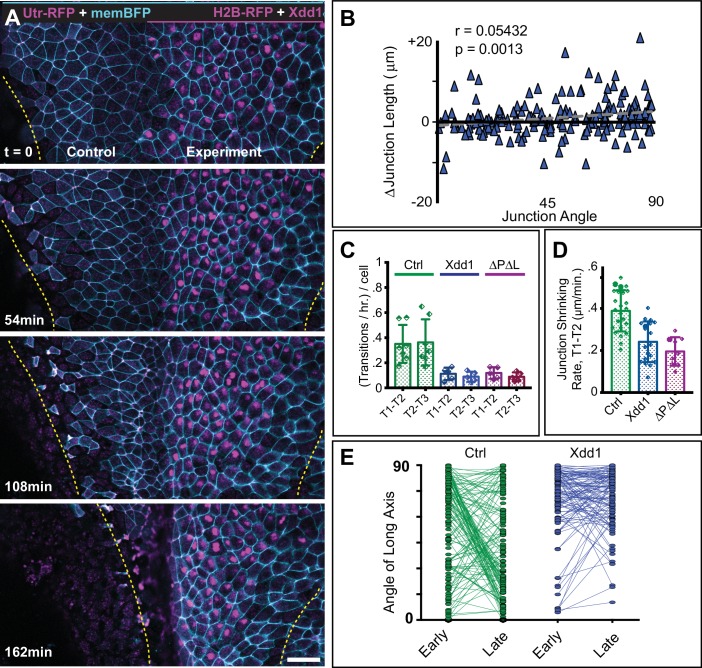
Figure 4. PCP function is required for polarized junction shrinking in the neural plate.
(A) Confocal images from a Xenopus neural plate evenly labeled with membraneBFP and Utrophin-RFP (actin biosensor), but mosaically co-expressing H2B-RFP (magenta nuclei) together with Xdd1 on one side (right). The lateral boundaries of the neural plate are marked in each frame by yellow lines, demonstrating that Xdd1 expression disrupts the medial movement of the right neural fold in comparison to the control fold on the left. Scale = 50 µm (B) Graph of average angle of junctions versus junction length change for cells expressing Xdd1 to compare with control plot in Figure 3C. n = 187 junctions from four embryos across three experiments. (C) Graph with the total number of T transition events expressed as transitions per hour per the number of cells examined, with each point representing a single embryo. Error bars represent standard deviation. For statistical analysis, Control vs. Xdd1, and Control vs. Pk2-ΔPΔL ML, p=0.0025** for both classes of transitions (Mann-Whitney Test for significance). n = 4 experiments, seven embryos, 1167 cells (Control); three experiments, five embryos, 560 cells (Xdd1); three experiments, five embryos, 841 cells (Pk2-ΔPΔL). (D) The calculated rate of junction contraction for completed Type one to Type two transition (T1-T2) (complete contraction of a V-junction, see Figure 3A–a’). Error bars represent standard deviation. Ctrl vs. Xdd1, p<0.0001****, Ctrl vs. Pk2-ΔPΔL, p<0.0001****, Xdd1 vs. Pk2-ΔPΔL, p=0.2051. (Mann-Whitney statistical test). n = 24 junctions from four embryos across three experiments (Ctrl), n = 19, 2, 2 (Xdd1), and n = 9, 3, 3 (Pk2-ΔPΔL). (E) Plot of the angle of the long axis of control and Xdd1-expressing cells at Stages 12–12.5 (early) and Stages 13–14 (late), with lines connecting angles of the same cell at the two different time points. All measurements are from different regions of embryos that mosaically express Xdd1, similar to as shown in (A). n = 136 control cells and 114 Xdd1-expressing cells from four embryos across three experiments.
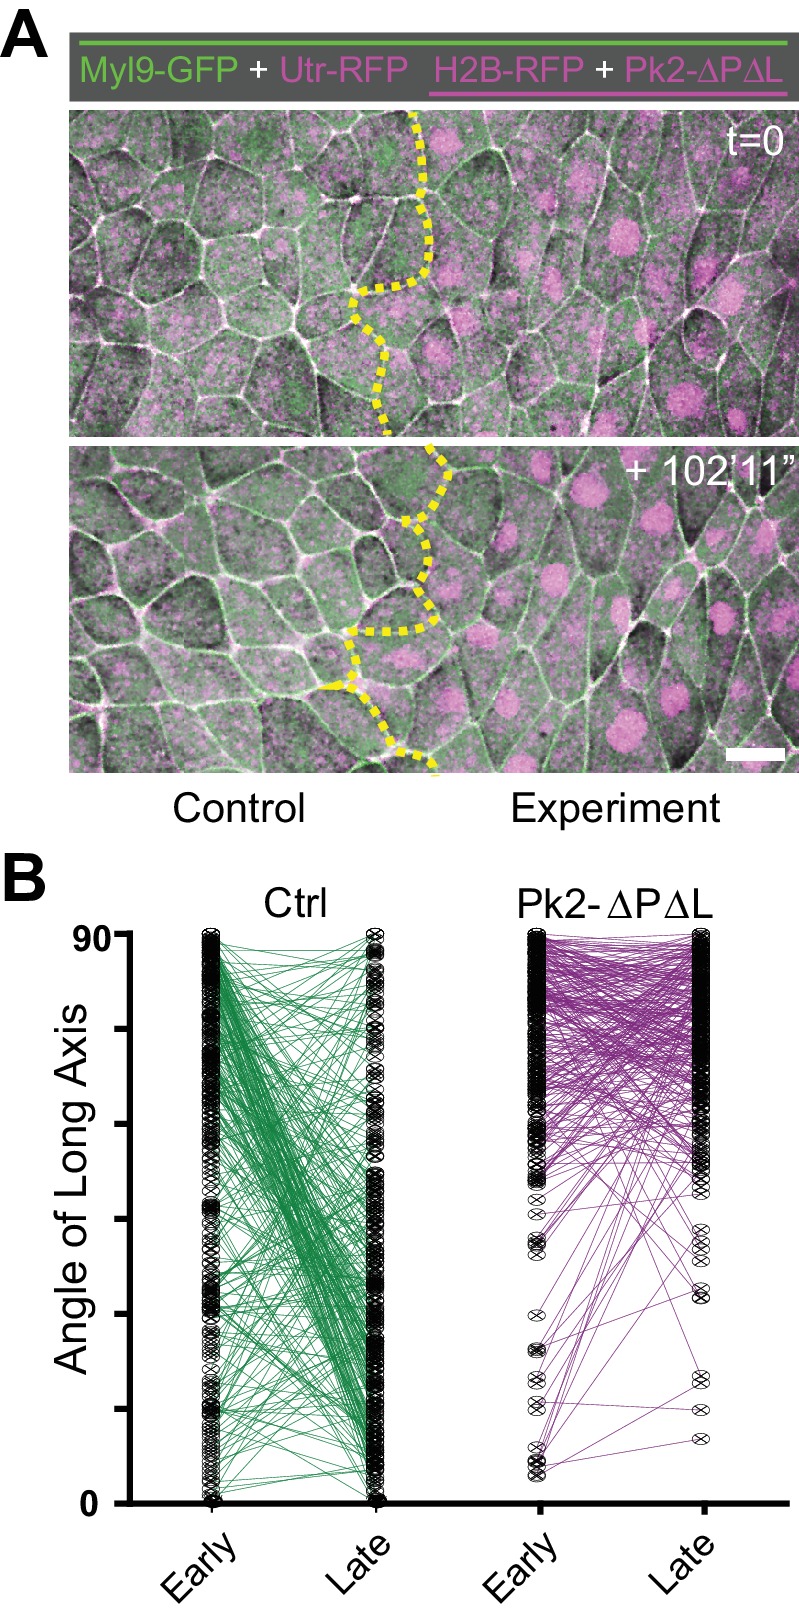
Figure 4—figure supplement 1. A dominant negative Pk2 disrupts polarized cell rearrangements.


