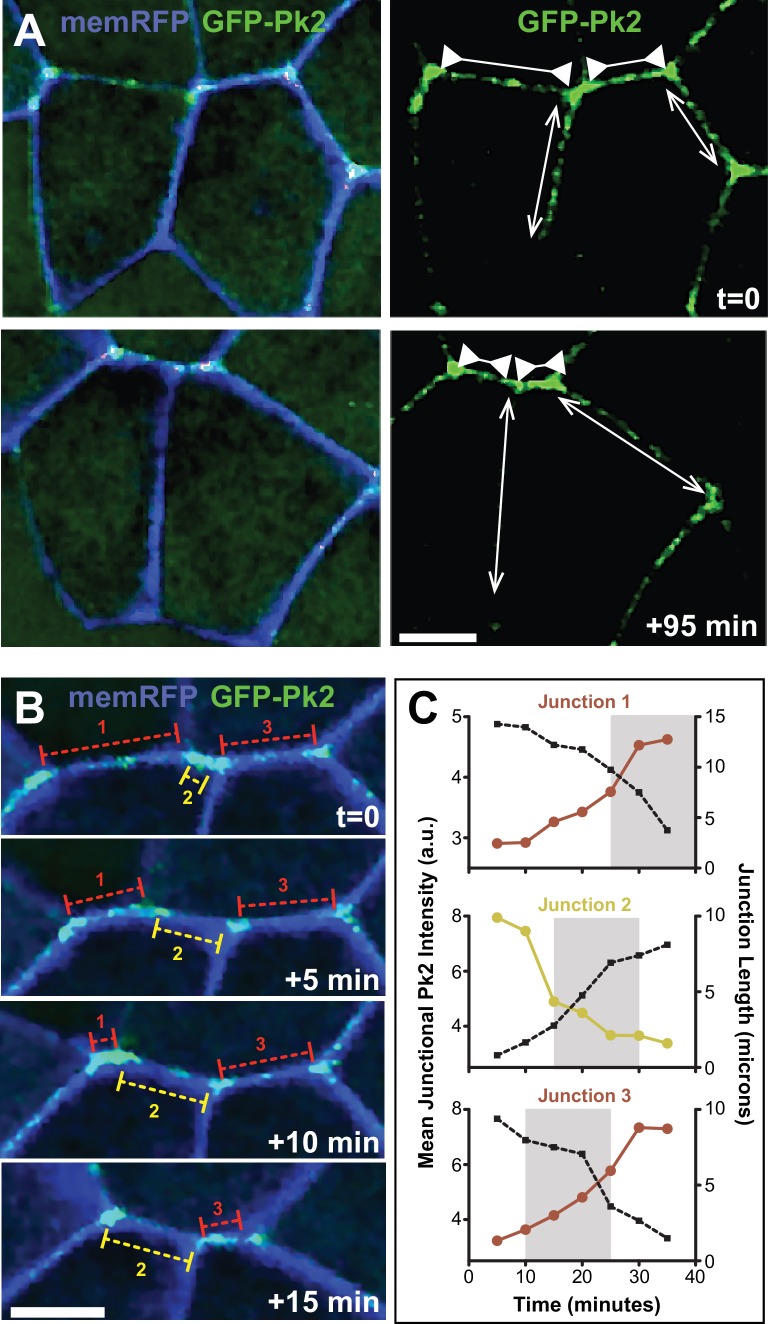
Figure 5. Pk2 is dynamically enriched at shrinking V-junctions.
(A) Confocal images of neural epithelial cells labeled with membraneRFP (pseudocolored blue) and GFP-Pk2 showing the change in length of shrinking junctions (inward facing arrowheads) and growing junctions (outward facing arrows) along with the corresponding change in GFP-Pk2 intensity at two different time points. Scale = 10 µm (B) Higher magnification view of the horizontal junctions shown in A, shown at 5-min intervals. Red brackets indicated shrinking junctions; yellow brackets indicate growing junctions. Scale = 10 µm (C) Plots of intensity (red/yellow traces) and length (black dashed traces) for each of the indicated junctions in Panel B. Plots show 30 min of junction dynamics ending in either junction resolution or junction formation and expansion; gray area behind select data points indicate the interval of the four frames shown in (B), which are offset due to different junctions appearing and resolving at different times.


