. 2018 Aug 17;7:e36691. doi: 10.7554/eLife.36691

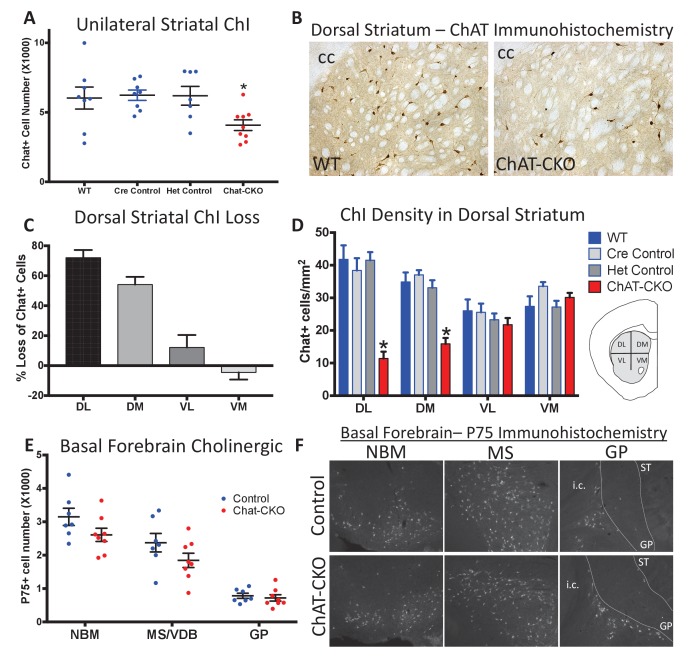
Figure 1. Conditional cholinergic neuron deletion of torsinA causes cell autonomous loss of striatal cholinergic neurons.

(A) Unilateral stereological quantification of the number of ChAT-positive neurons in the striatum of ChAT-CKO and control mice (One-way ANOVA F(3,28) = 3.589, p=0.02, Dunnett’s multiple comparisons test: adjusted p value = 0.049; ‘WT’=Tor1aFlx/+; ‘Cre Control’=ChAT-Cre+, Tor1a Flx/+; ‘Het Control’=Tor1 aFlx/-; ‘ChAT-CKO’=ChAT-Cre+, Tor1aFlx/-). (B) ChAT immunohistochemistry of coronal sections containing dorsal striatum from WT and ChAT-CKO mice (cc = corpus callosum). (C) Percent reduction in cell density by striatal quadrant (DL = dorsolateral; DM = dorsomedial, VL = ventrolateral, VM = ventromedial). (D) Significant ChI loss is selective for dorsal striatal quadrants. Cell density quantification in control and ChAT-CKO striatal quadrants (Two-way ANOVA main effect of genotype F(3,112) = 24.02, p<0.0001; main effect of quadrant F(3,112)=8.398, p<0.0001; interaction F(9,112)=8.11, p<0.0001. Post-hoc Tukey’s multiple comparisons test). (E) Basal forebrain neurons are spared in ChAT-CKO mice. Stereological quantification of P75-immunoreactive basal forebrain cholinergic neurons in the nucleus basalis of meynert (NBM), medial septum/nucleus of the vertical limb of the diagonal band (MS/VDB), and globus pallidus (GP). No differences in the number of cholinergic neurons was observed (NBM, t(13)=1.684, p=0.11; MS/VDB, t(13)=1.537, p=0.148; GP, t(13)=0.5, p=0.625). (F) P75 immunohistochemistry of sagittal sections containing basal forebrain cholinergic neuron populations. i.c. = internal capsule, ST = striatum.

Figure 1.

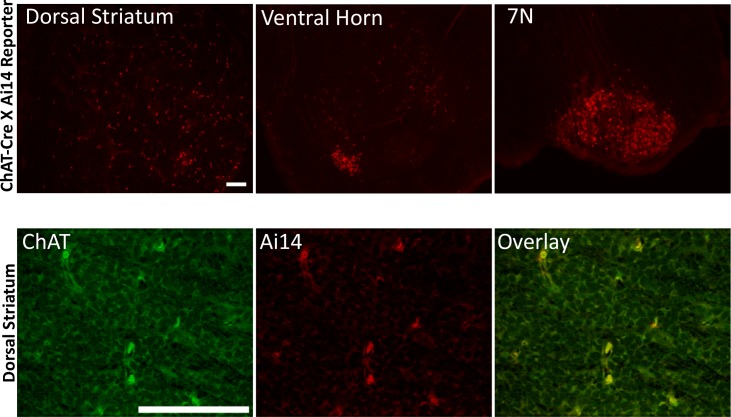
Figure 1—figure supplement 1. ChAT-Cre is expressed prenatally.

Figure 1—figure supplement 1.

(Upper panels) ChAT-Cre mice were crossed with Ai14 Cre reporter mice. Offspring were collected immediately after birth, brain sections were generated and observed under epifluorescence microscopy. (Lower panels) adjacent sections costained for torsinA. Scale bar = 50 μm.

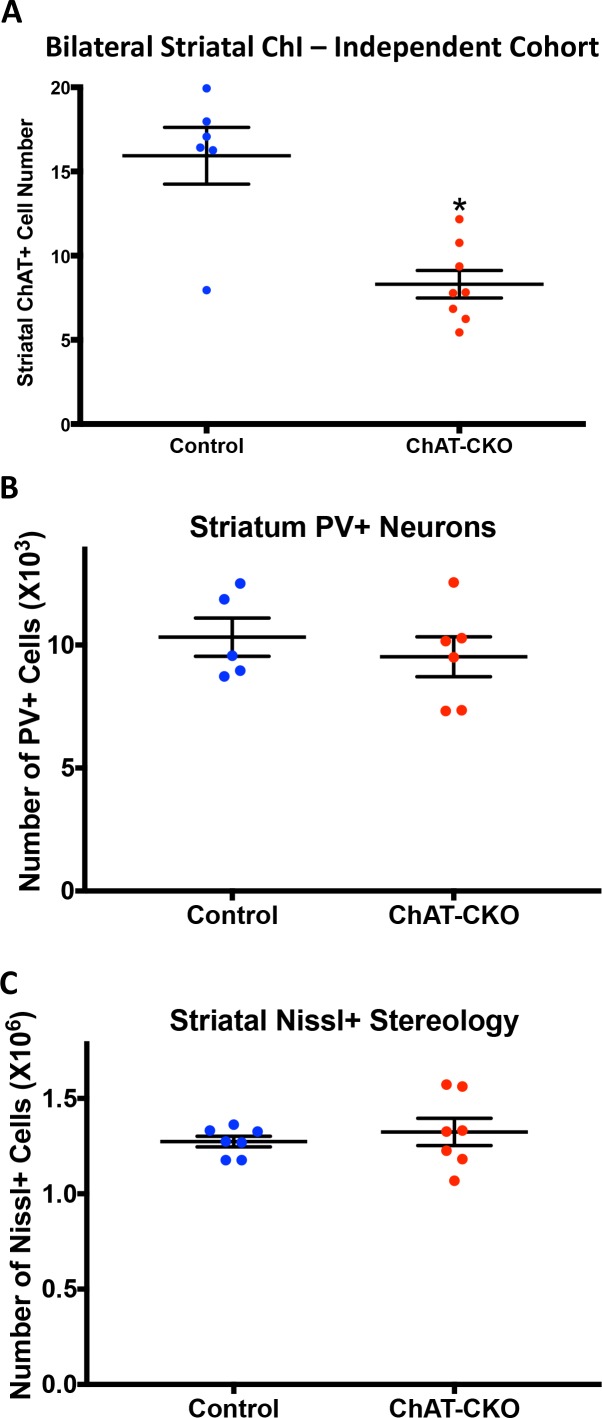
Figure 1—figure supplement 2. Independent cohort confirmation of selective striatal cholinergic neuron loss in ChAT-CKO mice.

Figure 1—figure supplement 2.

(A) Bilateral unbiased stereology of ChAT-immunoreactive neurons in the dorsal striatum (t(12)=4.42, p=0.0008). (B) Unbiased stereology of parvalbumin (PV) immunoreactive neurons in the dorsal striatum (t9 = 0.699, p=0.50). (C) Unbiased stereology of Nissl positive cells in the dorsal striatum (Welch’s t-test; t7.803=0.655, p=0.53).

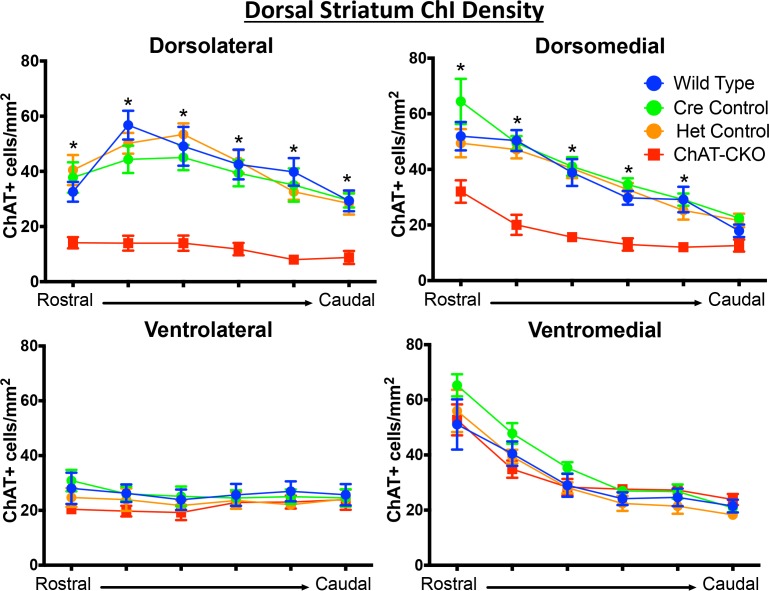
Figure 1—figure supplement 3. ChAT-positive neurons are reduced in a topographic pattern throughout the rostrocaudal extent of the dorsal striatum.

Figure 1—figure supplement 3.

Significant decreases in ChAT-positive cells were observed in the dorsolateral and dorsomedial segments of the dorsal striatum (dorsolateral striatum, two-way ANOVA main effect of genotype F(3,156)=74.77, p<0.0001, main effect of rostrocaudal section, F(5,156)=10.07, p<0.0001, no interaction F(15,156)=1.204, p=0.273; Dorsomedial striatum main effect of genotype F(3,156)=50.01, p<0.0001, main effect of rostrocaudal section, F(5,156)=41.81, p<0.0001, no interaction F(15,156)=1.646, p=0.067. Post-hoc Tukey’s test was performed for all significant main effects. * represents significant difference between ChAT-CKO mice and all control groups). No significant reductions were observed in the ventral segments of the dorsal striatum (ventrolateral; genotype F(3,156)=2.84, p=0.039 [post-hoc Tukey’s test adjusted p=0.129 or higher for all comparisons], rostrocaudal section F(5,156)=0.479, p=0.79, interaction F(15,156)=0.249, p=0.99. ventromedial; genotype F(3,156)= 2.706, p=0.047 [post-hoc Tukey’s test adjusted p=0.107 or higher for all comparisons], rostrocaudal section F(5,156)=46.28 p<0.0001, interaction F(15,156)=0.672, p=0.80).

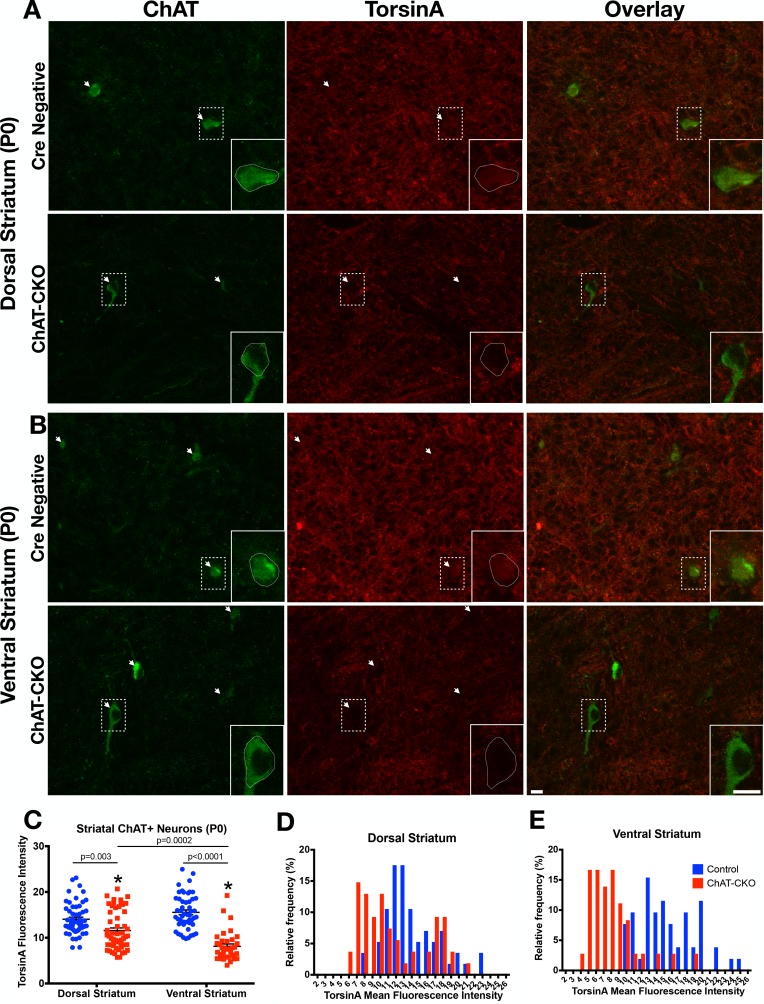
Figure 1—figure supplement 4. Time course of torsinA protein loss in dorsal and ventral striatum.

Figure 1—figure supplement 4.

(A,B) TorsinA and ChAT staining in dorsal and ventral striatum brain sections from P0 ChAT-CKO and control mice. (C) TorsinA mean fluorescence intensity analysis in dorsal or ventral striatal ChI (Two-way ANOVA main effect of genotype F1,195= 85.67, p<0.0001; Region, n.s., F1,195=3.301, p=0.07; interaction F1,195=21.34, p<0.0001. Sidak’s multiple comparisons test, Dorsal striatum control vs ChAT-CKO, p=0.003, Ventral striatum control vs ChAT-CKO, p<0.0001, ChAT-CKO dorsal striatum vs ventral striatum, p=0.0002; Control dorsal striatum vs ventral striatum, n.s., p=0.199). (D,E) Frequency histograms of torsinA mean fluorescence intensity in dorsal (n = 57 control, n = 54 ChAT-CKO neurons) and ventral striatal ChI (n = 52 control, n = 36 ChAT-CKO neurons). Scale bar = 10 µm.

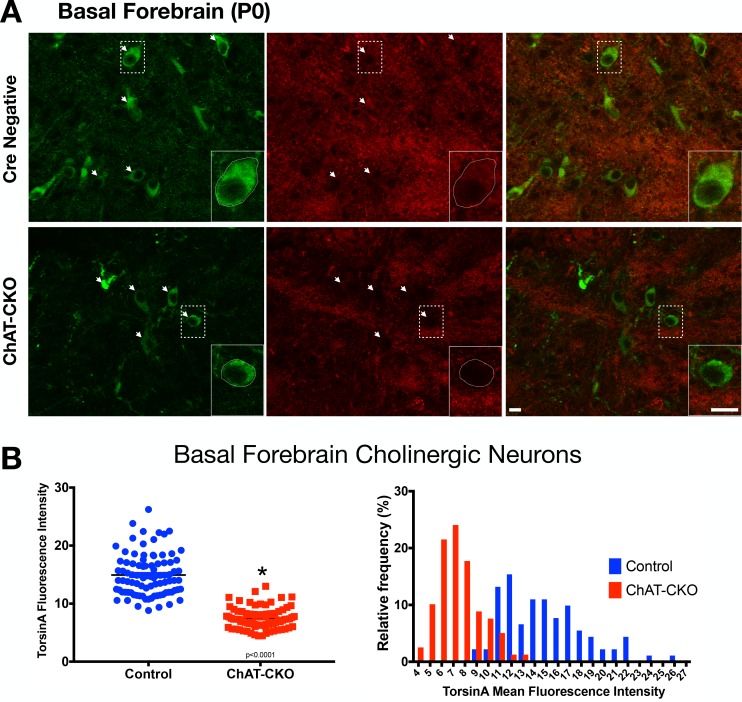
Figure 1—figure supplement 5. Time course of torsinA protein loss in basal forebrain.

Figure 1—figure supplement 5.

(A) TorsinA and ChAT staining in basal forebrain brain sections from P0 ChAT-CKO and control mice. (B) TorsinA mean fluorescence intensity analysis of control and ChAT-CKO (Welch’s t-test t138.2=17.35, p<0.0001) and frequency histograms of torsinA mean fluorescence intensity in basal forebrain cholinergic neurons ChI (n = 91 control, n = 79 ChAT-CKO neurons). Scale bar = 10 µm.