. 2018 Aug 13;7:e34793. doi: 10.7554/eLife.34793

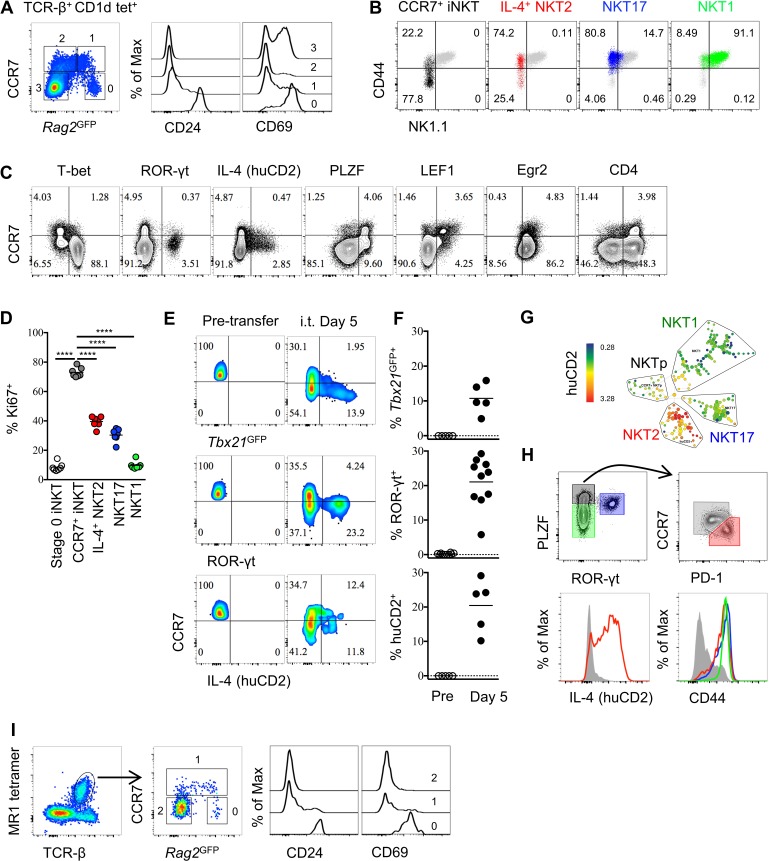
Figure 1. Thymic CCR7+ iNKT and MAIT cells are at an early developmental stage and give rise to distinct effector subsets in the thymus.

(A) Expression of Rag2GFP and CCR7 in thymic iNKT cells (TCR-β+ CD1d-PBS57+) (left column), and of CD24 (middle column) and CD69 (right column) on cells with different levels of Rag2GFP. Data are representative of 3 independent experiments with 3–4 mice in each. (B) Expression of NK1.1 and CD44 in thymic CCR7+ iNKT (black dots), IL-4+ (human CD2+) NKT2 (red dots), ROR-γt+ NKT17 (blue dots), T-bet+ NKT1 (green dots) cells together with total thymic iNKT cells (grey dots). Numbers in quadrants indicate percent cells in each for CCR7+ iNKT (black dots), IL-4+ (human CD2+) NKT2 (red dots), ROR-γt+ NKT17 (blue dots) and T-bet+ NKT1 (green dots) cells. Data are representative of 4 independent experiments with 2–3 mice in each. (C) Expression of T-bet, ROR-γt, huCD2, PLZF, LEF1, Egr2 and CD4 with CCR7 in thymic iNKT cells (TCR-β+ CD1d-PBS57+ CD24). Data are representative of 3 independent experiments with 2–3 mice in each. Numbers in quadrants indicate percent cells in each (throughout). (D) Frequency of Ki67+ cells in each population of thymic iNKT cells. Data are pooled from three independent experiments with 2–3 mice in each. ****p<0.0001 (one-way ANOVA, Tukey’s multiple comparisons test) Each symbol represents an individual mouse; small horizontal lines indicate the mean. (E) Expression of Tbx21GFP, ROR-γt and human CD2 in CCR7+ iNKT cells sorted from BALB/c Tbx21GFP KN2 mice before intra-thymic transfer (left column) or 5 days after transfer in the thymus of congenic BALB/c recipient mice (right column). (F) Frequency of Tbx21GFP+, ROR-γt+ or human CD2+ cells in donor cells before or 5 days after intra-thymic transfer into the thymus of congenic BALB/c recipient mice. Each symbol represents an individual recipient mouse; small horizontal lines indicate the mean. (G) SPADE analysis of thymic iNKT cells from B6 KN2 mice supports that CCR7+ NKTp are a distinct lineage from the effector subsets, NKT1, NKT2 and NKT17. Representative figure shows differential expression of human CD2 in each population of iNKT cells. (H) CCR7 and PD-1 distinguish two cell populations (top row, right column) within PLZFhi iNKT cells (top row, left column), and expression of human CD2 and CD44 in CCR7+ NKTp (grey), NKT1 (green), NKT2 (red) and NKT17 (blue) are shown as overlays (bottom row). Data are representative of 3 independent experiments with 3 mice in each. (I) Expression of Rag2GFP together with CCR7 (middle column) in thymic MAIT cells (far left column), and expression of CD24 and CD69 in CCR7+ and CCR7 MAIT cells with different level of Rag2GFP (far right two columns). Data are representative of 2 independent experiments with 3 mice in each.

Figure 1—source data 1. High proliferative and precursor potential of CCR7+ iNKT cells.
DOI: 10.7554/eLife.34793.006
Figure 1—source data 2. Thymic CCR7+ iNKT cells are distinguished from stage 0 iNKT cells and give rise to iNKT subsets in periphery.
DOI: 10.7554/eLife.34793.007
Figure 1—source data 3. Consistent, robust and unbiased labeling of thymocytes by intra-thymic injection of biotin.
DOI: 10.7554/eLife.34793.008

Figure 1.

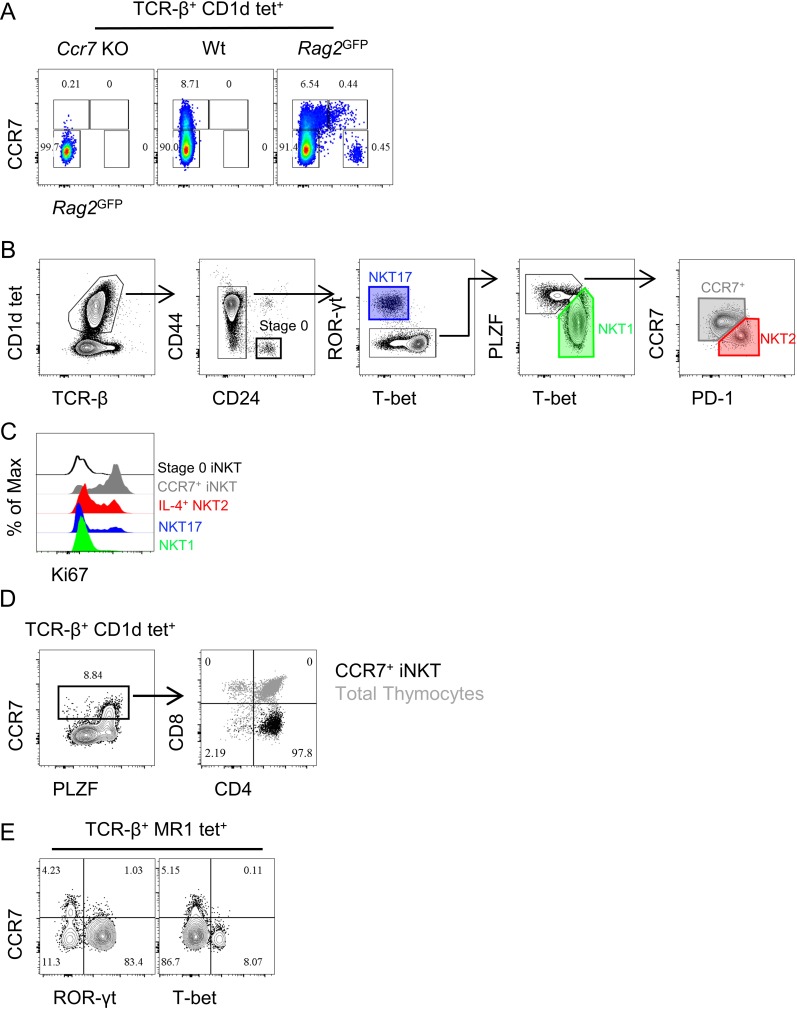
Figure 1—figure supplement 1. Specific CCR7 staining in iNKT cells and gating strategy of iNKT subsets and CD4/CD8 profile of CCR7+ iNKT and CCR7+ MAIT cells.

Figure 1—figure supplement 1.

(A) Representative flowcytometry profile of CCR7 staining in thymic iNKT cells enriched from Ccr7−/−, Wt and Rag2GFP mouse. (B) Gating strategy to identify enriched thymic iNKT cells as well as various subpopulations of iNKT cells, stage 0 iNKT (heavy black line), CCR7+ iNKT (grey polygon), NKT1 (green polygon), NKT2 (red polygon) and NKT17 cells (purple rectangle). (C) Representative staining of Ki67 in various subpopulations of iNKT cells, stage 0 iNKT (black), CCR7+ iNKT (grey), NKT1 (green), NKT2 (red) and NKT17 cells (purple). Data are representative of three independent experiments with 2–3 mice in each. (D) CD4/CD8 profile of thymic CCR7+ iNKT cells. Identification of CCR7+ cells in enriched thymic iNKT cells (left column), and CD4/CD8 profile of CCR7+ iNKT cells (black dots) relative to the total thymocytes (grey dots) from the same mouse (right column). Number indicates percent cells in each gate. (E) Expression of T-bet and ROR-γt with CCR7 in thymic MAIT cells (TCR-β+ CD1d-PBS57+). Data are representative of 2 independent experiments with 2 mice in each.
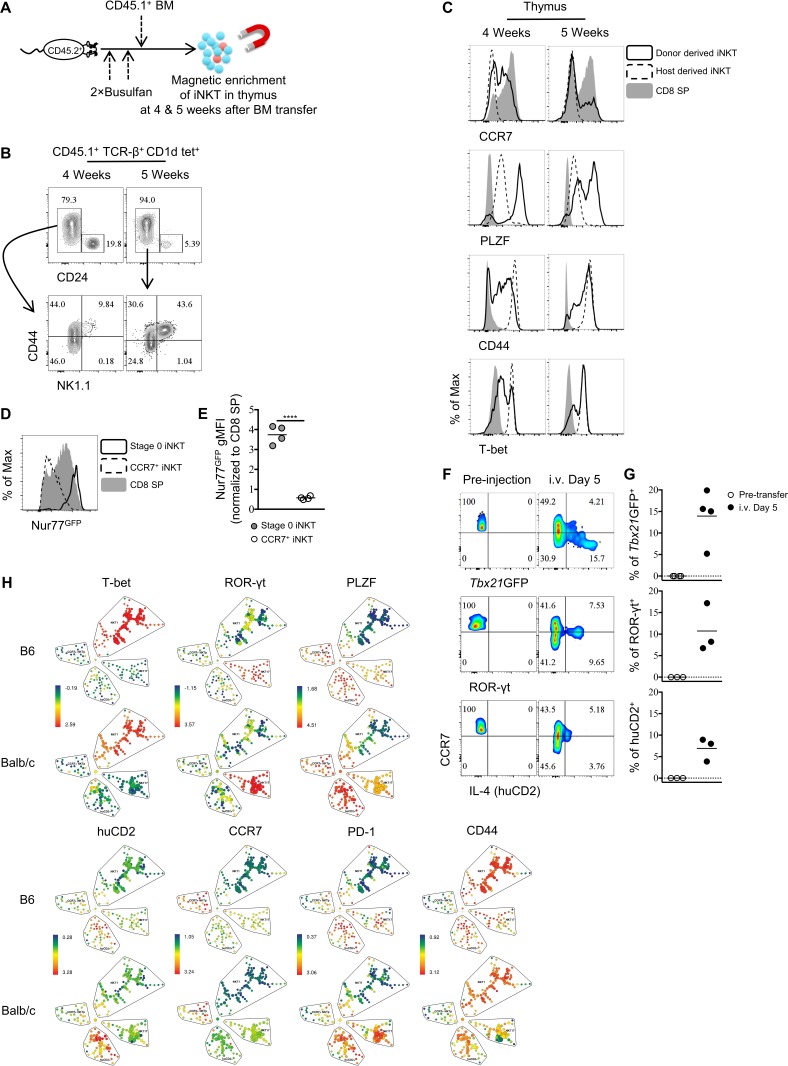
Figure 1—figure supplement 2. Thymic CCR7+ iNKT cells are enriched at an early timepoint in busulfan induced BM chimera.

Figure 1—figure supplement 2.

(A) Experimental scheme to generate busulfan induced bone marrow chimeras and evaluate iNKT phenotype. (B) Frequency of CD24+ CD44 stage 0 iNKT cells among total iNKT cells (TCR-β+ CD1d tet+) (top row) and expression of NK1.1 and CD44 in the CD24 iNKT cells (bottom row) in the thymus at indicated time point after bone marrow chimera induction. (C) Expression of CCR7, PLZF, CD44 and T-bet in donor derived iNKT, host derived iNKT and total CD8 SP cells in the thymus at indicated time point after bone marrow chimera induction. (D) Expression of Nur77GFP in Stage 0 iNKT cells (TCR-β+ CD1d tet+ CD44 CD24+), CCR7+ iNKT cells and CD8 SP thymocytes. Data are representative of 2 independent experiments with two mice in each. (E) Normalized gMFI of Nur77GFP in stage 0 iNKT and CCR7+ iNKT cells. Data are pooled from two independent experiments with two mice in each. ****p<0.0001 (unpaired two tailed t test). Each symbol represents an individual mouse; small horizontal lines indicate the mean. (F) Expression of Tbx21GFP, ROR-γt and human CD2 in CCR7+ iNKT cells sorted from BALB/c Tbx21GFP or BALBc KN2 mice before intravenous injection (left column) or 5 days after injection of congenic BALB/c recipient mice, in the spleen (right column). (G) Frequency of Tbx21GFP+, ROR-γt+ or human CD2+ cells in donor derived iNKT cells before or 5 days after intravenous injection of congenic BALB/c recipient mice, in the spleen. Each symbol represents an individual recipient mouse; small horizontal lines indicate the mean. (H) SPADE analysis of thymic iNKT cells from B6 and BALB/c KN2 mice shows CCR7+ NKTp is a distinct lineage from the effector subsets, NKT1, NKT2 and NKT17. Representative figure shows differential expression of T-bet, ROR-γt, PLZF, huCD2, CCR7, PD-1 and CD44 in each population of iNKT cells.
Figure 1—figure supplement 3. Ultrasound imaging guided intra-thymic injection.

Figure 1—figure supplement 3.

(A) Representative ultrasound image of mouse chest area, the thymus is outlined by white dotted line (left column), the red arrow indicates the needle tip in thymus before injection (middle column), after injection the red arrow indicates the injected NHS-biotin contained in the thymus (right column). (B) Representative flowcytometry profile and (C) frequency of biotinylated cells revealed by streptavidin-PE staining in various cell populations (iNKT, CD4 SP, CD8 SP and total thymocytes) in the thymus 24 hr later after intra-thymic injection of PBS or NHS-biotin. Data are pooled from six independent experiments with 2–6 mice in each. ns, not significant, p>0.05 (one-way ANOVA). Each symbol represents an individual mouse; Mean ± SD. (D) Representative flowcytometry profile of CD1d tetramer staining in thymocytes of Cd1d KO or Wt mouse received intra-thymic injection of PBS or NHS-biotin.