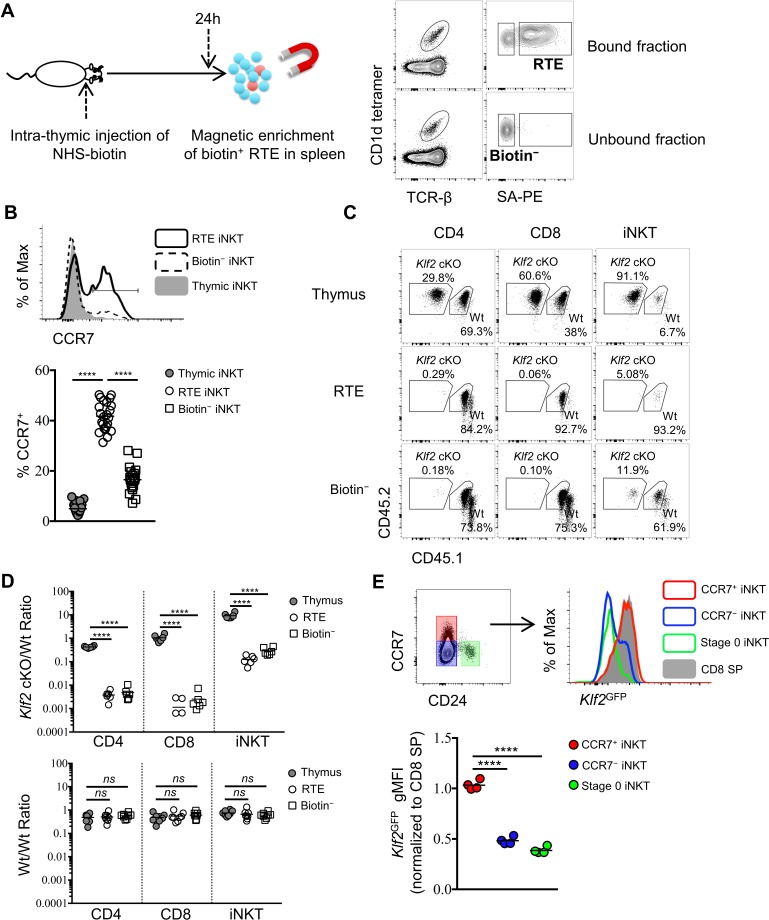
Figure 2. CCR7+ iNKT cells are enriched in the emigrating iNKT population and depend on Klf2.
(A) Experimental scheme to track recent thymic emigrants (RTE) through intra-thymic injection of NHS-biotin (left column) followed by enrichment of biotin+ splenic cells 24 hr after intra-thymic labeling, compared to ‘old’ cells (biotin– cells from spleen) (right column). (B) Expression of CCR7 in thymic, RTE and biotin− iNKT cells, the grey shade represents thymic iNKT cells, the solid black line represents RTE iNKT cells, the dashed black line represents biotin− iNKT cells (top row); frequency of CCR7+ cells in thymic, RTE and biotin− iNKT cells, the solid grey circle represents thymic iNKT cells, the open circle represents RTE iNKT cells, the open square represents biotin− iNKT cells (bottom row). Data are pooled from 5 independent experiments with 3–6 mice in each. ****p<0.0001 (one-way ANOVA) Each symbol represents an individual mouse; small horizontal lines indicate the mean. (C) Mixed bone marrow chimeras were generated with 25:75 ratio of donor bone marrow cells using CD45.2+ CD45.2+ B6 Klf2 cKO cells and CD45.1+ CD45.2+ B6 Wt cells, or with 50:50 ratio of donor bone marrow cells using CD45.2+ CD45.2+ B6 Wt cells and CD45.1+ CD45.2+ B6 Wt cells. Eight weeks later, chimeras received intra-thymic labeling with NHS-biotin to track RTE among CD4, CD8 and iNKT cells. Data are representative of 2 independent experiments with 4–8 mice in each. (D) Statistical analysis of thymic, RTE and biotin− CD4 T cells, CD8 T cells and iNKT cells in 8-week-old BM chimeras reconstituted with Klf2 cKO and Wt cells (top row) or with Wt and Wt cells (bottom row). Data are pooled form 2 independent experiments with 4–8 mice in each. Numbers indicate the ratio between the cells derived from each donor source. ****p<0.0001 (one-way ANOVA). ns, not significant, p>0.05 (one-way ANOVA). Each symbol represents an individual mouse; small horizontal lines indicate the mean. (E) Expression of Klf2GFP in CCR7+ iNKT, stage 0 iNKT, CCR7– iNKT cells and CD8 SP cells (top row). Normalized gMFI of Klf2GFP in CCR7+ iNKT, stage 0 iNKT, CCR7– iNKT cells (bottom row). Data are pooled from 2 independent experiments with 2 mice in each. ****p<0.0001 (one-way ANOVA). Each symbol represents an individual mouse; small horizontal lines indicate the mean.


