Figure 1:

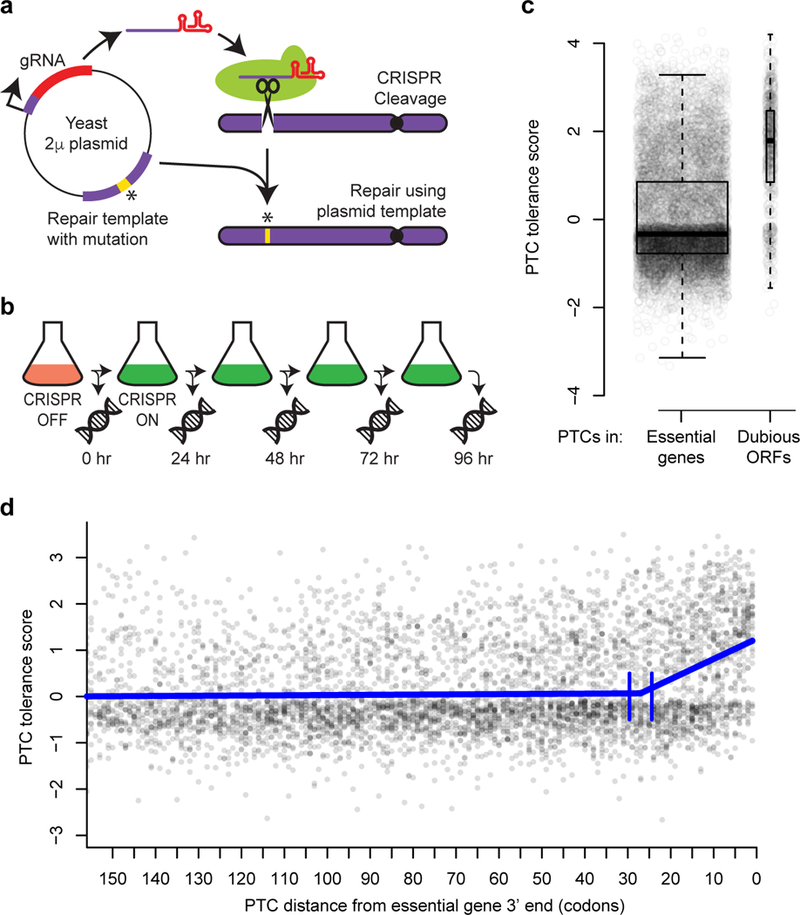
Measuring the effects of engineered PTCs in essential genes. a, Schematic of pairing of CRISPR gRNA and repair template on plasmids. b, Experimental design. Following Cas9 induction, DNA was extracted every 24 hours. At each time point, edit-directing plasmids were quantified by sequencing. c, Tolerance scores for n = 8,353 PTCs targeting essential genes and n = 694 PTCs targeting dubious ORFs are shown, with overlaid boxplots. The centerline of each box corresponds to the data’s median value; the top and bottom of the box span from the first quartile to the third quartile of the data; and the whiskers reach to either the data’s most extreme values or 1.5 times the interquartile range. P < 2 × 10⁻¹⁶, two-sided Wilcoxon rank sum test. d, Scatterplot of PTC tolerance scores versus distance in codons from the 3’ ends of essential genes. The thick blue line shows a segmented regression fit. Vertical blue lines indicate the 95% confidence interval for the boundary between the segments. The segmented regression was fit on PTC tolerance scores for n = 7,583 PTCs that were within 500 codons of the 3’ end of a gene.
