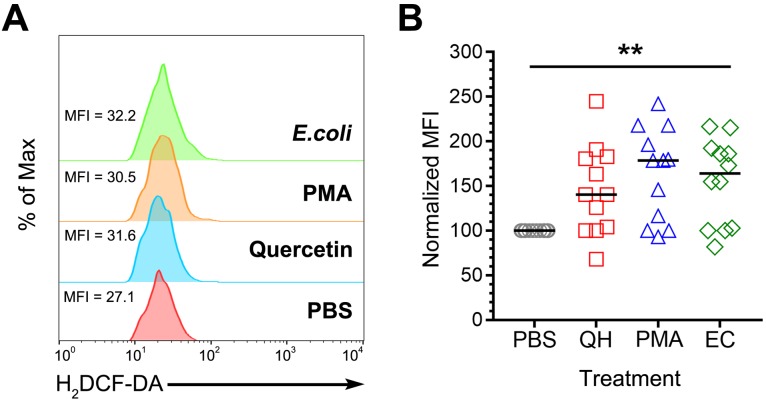
Fig. 1.
ROS generation in heterophil stimulated with quercetin and other stimulants by flow cytometry. (A) Representative offset histograms showing mean fluorescence intensity (MFI) values of ROS-positive cells from each treatment (PBS, quercetin (QH), PMA & Escherichia coli, EC). The height of histograms correlates to % of max. (B) Inclusive scatter plots generated from normalized MFIs to PBS to reduce inter-experimental variability. Each data point corresponds to an individual chick (n=12 each treatment). Data are the medians of two separate experiments, Kruskal-Wallis Test, **P<0.01.

