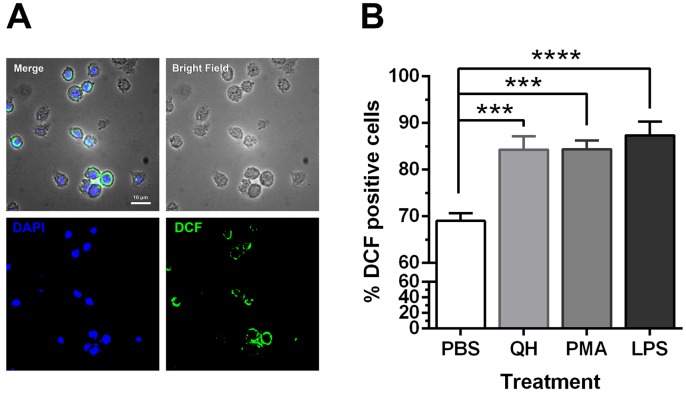
Fig. 2.
Characteristics of ROS-containing heterophils visualized by fluorescence microscope. (A) Representative set of fluorescence micrographs of quercetin-stimulated heterophils depicting intracellular stained ROS molecules (DCF) counter-stained with DAPI to indicate cell nuclei. The images were captured at 400 × magnification after a 45-min stimulation period; scale bar=10 µm. (B) Bar graphs represent percentage of DCF positive cells. Results are inclusive of three separate experiments. Data is represented as mean ± SE (n=13−15 each treatment), one-way ANOVA, ***P<0.001, ****P<0.0001.

