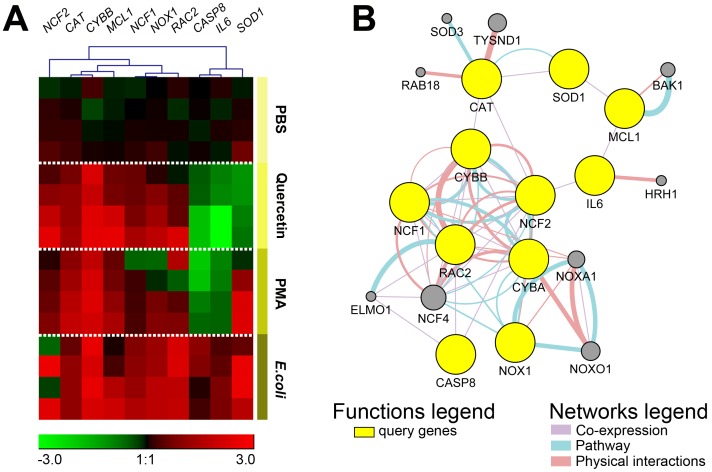
Fig. 4.
(A) Unsupervised clustering analysis (Pearson correlation, average linkage method) of gene expression in chicken heterophil ROS generation. Heat map was generated by a log transformation of 2-ΔΔCt values and is presented as individual data points. Columns represent specific ROS subunits, antioxidants, and downstream genes and the rows represent individual samples in the PBS, quercetin, PMA, and E. coli groups (n=4 per group). Expression values ranged from −3 to +3. Red indicates increased expression, green indicates decreased expression, and black indicates no change in expression. Expression levels are according to the color scale of the log2 values. (B) GeneMANIA Cytoscape interaction network of known gene co-expression, physical interactions, and genes involved in the ROS pathway. Yellow nodes represent query gene lists. Additional genes are predicted to be involved in the network (gray nodes).

