
Figure 2. SHP2 inhibition suppresses growth and RAS/MAPK signaling in cancer cell lines with class 3 BRAF mutations.
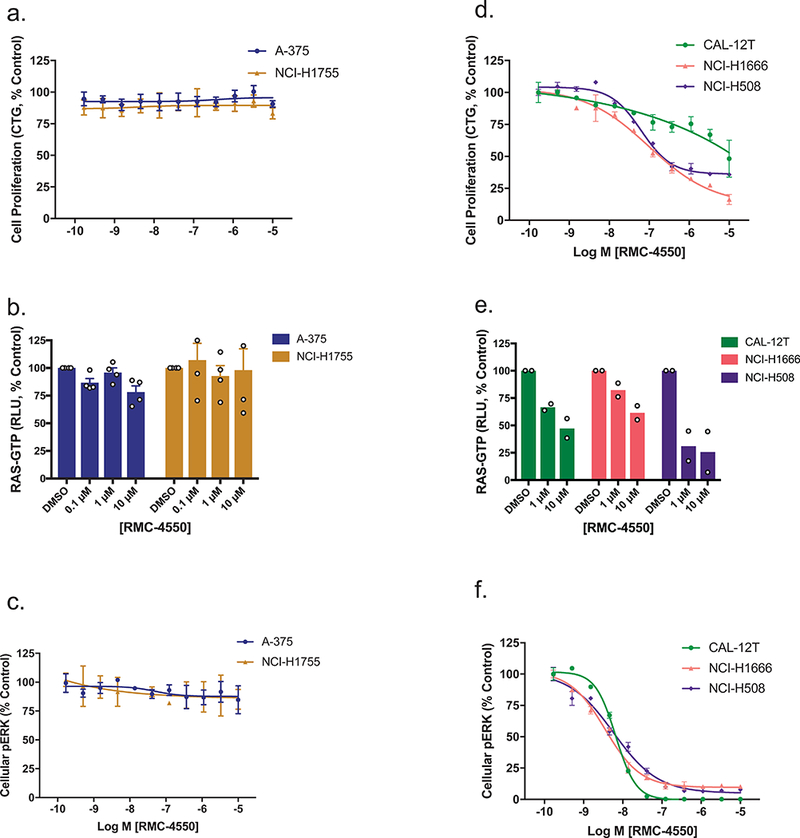
(a) Effect of RMC-4550 on proliferation of class 1 (A-375, BRAFV600E) and class 2 (NCI-H1755, BRAFG469A) BRAF mutant cell lines in 3D culture. Data represent 4 independent experiments each performed in technical duplicate. Figure shows mean +/− S.D. b) and c) A-375 and NCI-H1755 cells were grown in 2D culture and incubated with increasing concentrations of RMC-4550 for one hour. Cellular lysates were prepared and levels of RAS-GTP (b) and pERK (c) determined. RMC-4550 had no effect on cellular RAS-GTP or pERK levels in either cell line up to the maximal test concentration of 10 μM. RAS-GTP data show mean +/− S.E.M. of n = 4 independent biological experiments. pERK data are representative of n = 4 independent biological experiments each performed in duplicate; figures show mean +/− S.D. d) Effect of RMC-4550 on proliferation of three class 3 BRAF mutant cell lines (CAL-12T, BRAFG466V/+; NCI-H1666, BRAFG466V/+, NCI-H508, BRAFG596R/+) in 3D culture. RMC-4550 exhibited geometric mean IC50 values of >10 μM, 304 nM, and 19 nM, respectively, for growth inhibition in CAL-12T, NCI-H1666, and NCI-H508 cells (data are representative of n=4 independent biological experiments each performed in duplicate; figures show mean +/− S.D.) e) and f) CAL-12T, NCI-H1666, and NCI-H508 cells were grown in 2D culture and incubated with increasing concentrations of RMC-4550 for one hour. Cellular lysates were prepared and levels of RAS-GTP (e) and pERK (f) determined. RAS-GTP levels in CAL-12T, NCI-H1666, and NCI-H508 cells were inhibited in a concentration-dependent manner by RMC-4550. RMC-4550 produced a concentration-dependent reduction in pERK levels in CAL-12T, NCI-H1666, and H508 cells with geometric mean IC50 values of 7 nM, 6 nM, and 4 nM respectively (n = 2 biologically independent observations for RAS-GTP, and n = 4 biologically independent experiments for pERK, in duplicate; figures show mean +/− S.E.M. for RAS-GTP and mean +/− S.D. for pERK.) Source data is provided in Supplementary Table 9.