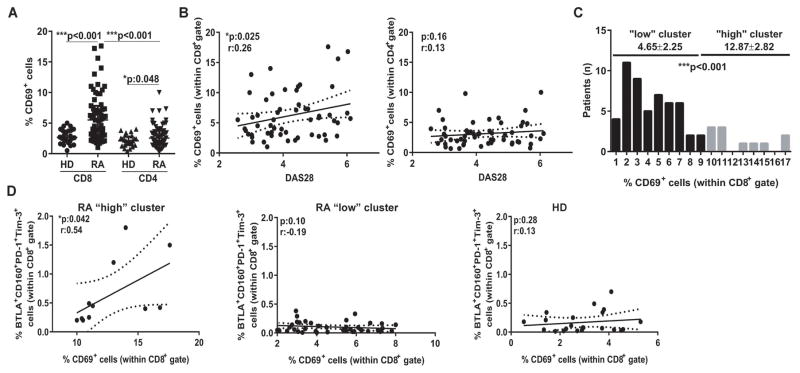
Figure 1. Evaluation of T cell activation status and IR expression.
A, Frequency of CD69+ cells within peripheral CD8+ and CD4+ T cells from HD and RA patients. Median±interquartile range is shown. B, Correlations of frequencies of CD69+ cells within CD8+ and CD4+ T cell gates with DAS28 from RA patients. C, Histogram of distribution of the frequencies of CD69+ cells within CD8+ T cell gate from RA patients. The cut-off value of 10 allowed to define two clusters of RA patients showing “low” and “high” T cell activation with significantly different means. D, Correlations between the frequencies of BTLA+CD160+PD-1+Tim-3+ cells and CD69+ cells within CD8+ T cell gate in RA patients from the “high” and “low” clusters and HD. Statistical analysis: p values calculated with Mann-Whitney Test (A and C) and with Pearson’s correlation coefficient (B and D).

