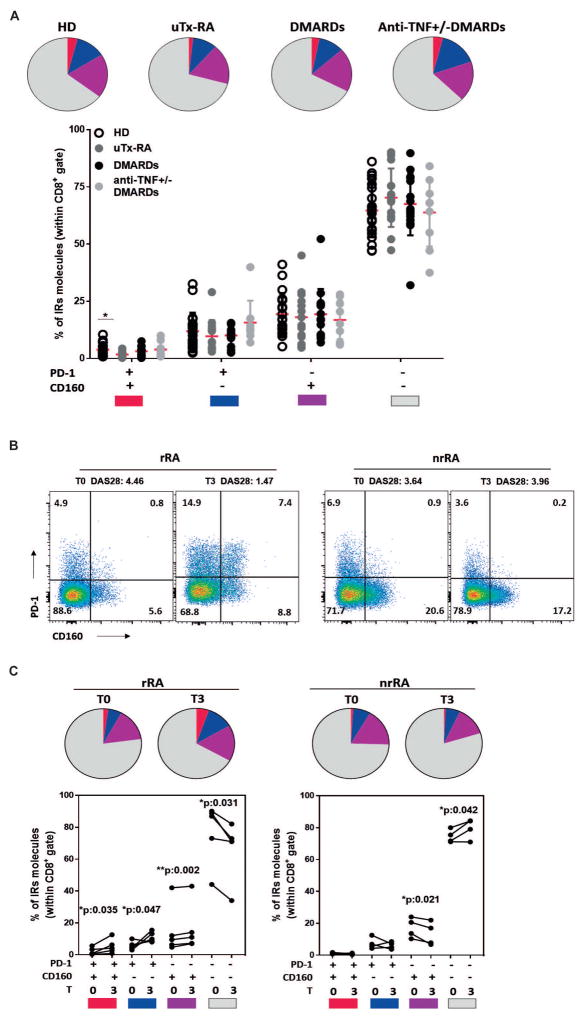
Figure 2. Changes in the frequency of PD-1 and/or CD160 expressing T cells were linked to clinical response to treatment.
A, Pie charts showing the average values and symbol plot showing the individual values of the frequencies of peripheral CD8+ T cells expressing different color-coded combinations of PD-1 and CD160 in samples from HD, untreated (uTx-RA), and DMARDs and anti-TNF±DMARDs treated RA patients. B, Representative dot plots showing the frequency of peripheral CD8+ T cells expressing PD-1 and CD160 in one rRA and one nrRA patient in paired samples at baseline (T0) and 3 months post-treatment (T3). Changes in DAS28 are indicated above the plots. C, Pie charts showing the average values and symbol plots showing the individual values of the frequencies of peripheral CD8+ T cells expressing different color-coded combinations of PD-1 and CD160 in paired samples from rRA and nrRA patients at T0 and T3. Statistical analysis: p values calculated with One-way Anova followed by Bonferroni post-test (A) and Student’s paired T test (B and C).

