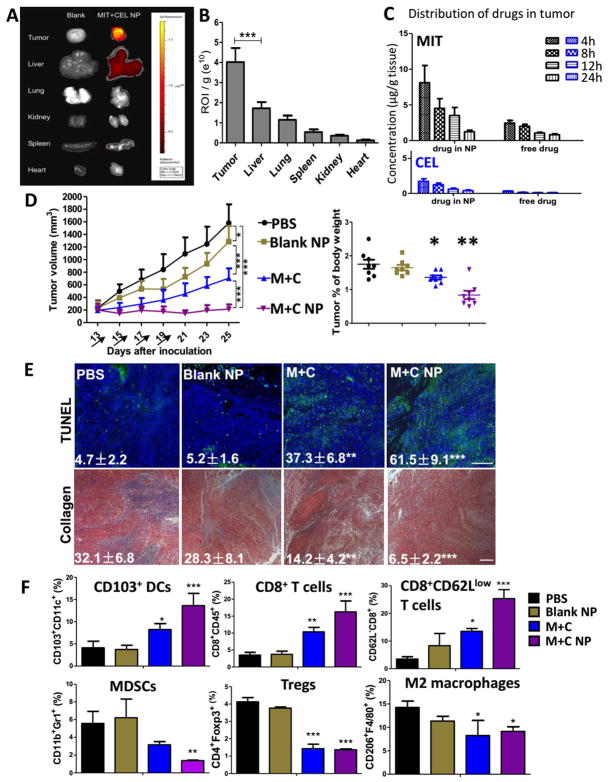
Figure 3. Effective therapy significantly improved anti-tumor response and remodeled suppressive TME.
(A) NP distribution in tumor-bearing mice. Mice were i.v. injected with Cy5-loaded (3 μg/kg) NPs and measured by IVIS imaging 24 h post-injection. n = 3; (B) Region-of-interest intensities of fluorescence signals among tumor and organs. n = 3; (C) Pharmaco-distribution of MIT and CEL within tumor were measured by LC/MS, n = 5; (D) Tumor inhibition study and tumor weight comparison. Arrows indicate days of drug injection. Dosage: for M+C group: ~2 mg/kg of CEL per dose; for M+C NP group: ~160 μg/kg of CEL per dose. Tumors were surgically removed from the hosts at endpoint of study, weighted and compared between groups. n = 10–12; (E) Cell apoptosis were measured by TUNEL staining and collagen morphology changes were measured by Masson’s trichrome staining, scale bar indicates 300 μm. n = 3. (F) Flow cytometry analysis of immune functioning cells within TME. n = 3. *: p < 0.05, **: p < 0. 01, ***: p < 0. 001.

