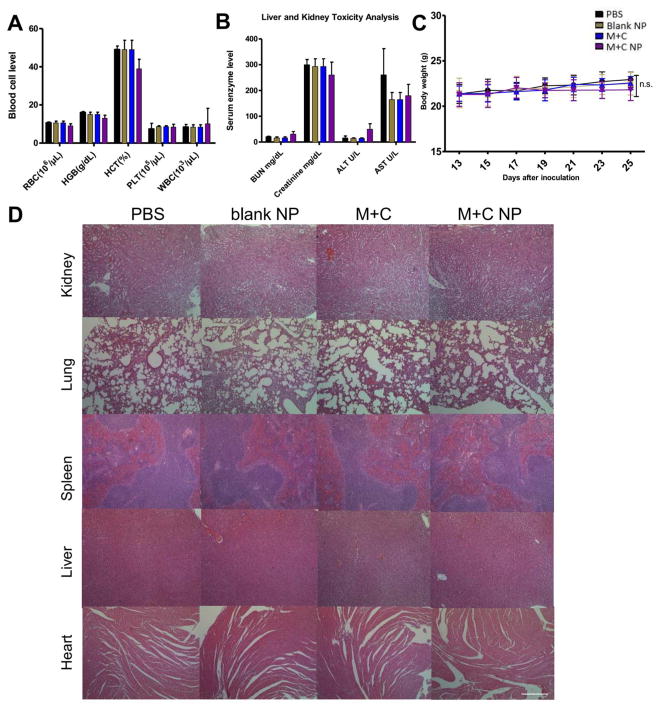
Figure 6. Toxicity evaluation of therapies.
(A) and (B) are whole cell counts and serum biochemical marker analysis of tumor bearing mice. Fresh whole blood and serum were collected at endpoint of study. All indicators were among normal biological range. (C) Mice body weight changes under tumor inhibition study. (D) H&E morphology under different therapies. Major organs were collected at endpoint of study and sectioned, stained for H&E analysis. Scale bar indicates 300 μm. n = 5. n.s.: p > 0.05.

