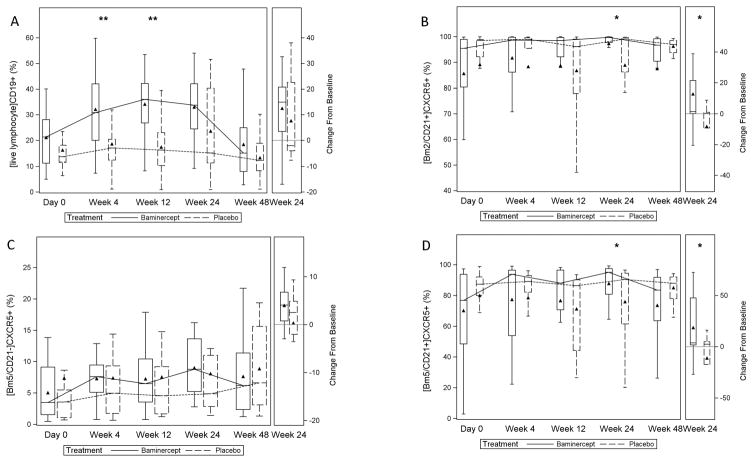
Figure 1. B cell subsets over time.
Frequency of subsets of B cells over time and the changes at week 24. Peripheral blood was obtained at day 0, week 4, week 12, week 24, and week 48 and analyzed by flow cytometry as described in Methods. Data are plotted as percent (subset analyzed indicated in brackets); ** P < 0.01, * P< 0.05, Wilcoxon rank-sum test for treatment group differences in the change from baseline. A-CD19+ B cells; week 4, p=0.006; week 12, p=0.005; week 24, p=0.320; B-[Bm2CD21+]CXCR5+ cells; week 4, p=0.244; week 12, p=0.122; week 24, p=0.033; C-[Bm5CD21−]CXCR5+ cells; week 4 p=0.357; week 12 p=0.820; week 24 p=0.162; D-[Bm5CD21+]CXCR5+ cells; week 4, p=0.159; week 12, p=0.066; week 24 p=0.027. Triangle = mean; line = median; bar = 25–75th percentile; whiskers = Q1 – 1.5*IQR, Q3 + 1.5*IQR.

