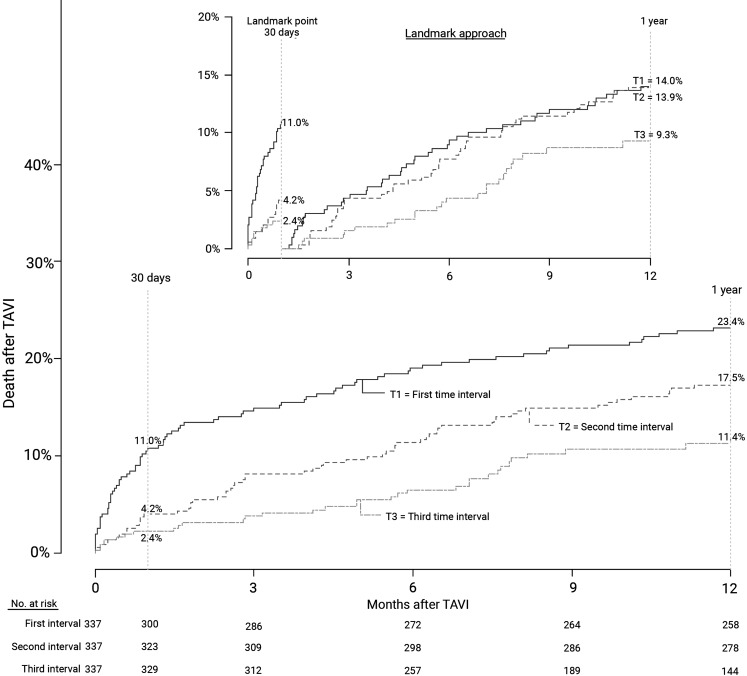
Fig. 3.
Time to event curve—death from any cause since TAVI. Mortality rates per procedural time interval. Numbers are the cumulative incidence estimates at the landmark point at 30 days and 1 year. The inset shows the analysis with a landmark approach. (TAVI transcatheter aortic valve implantation)

