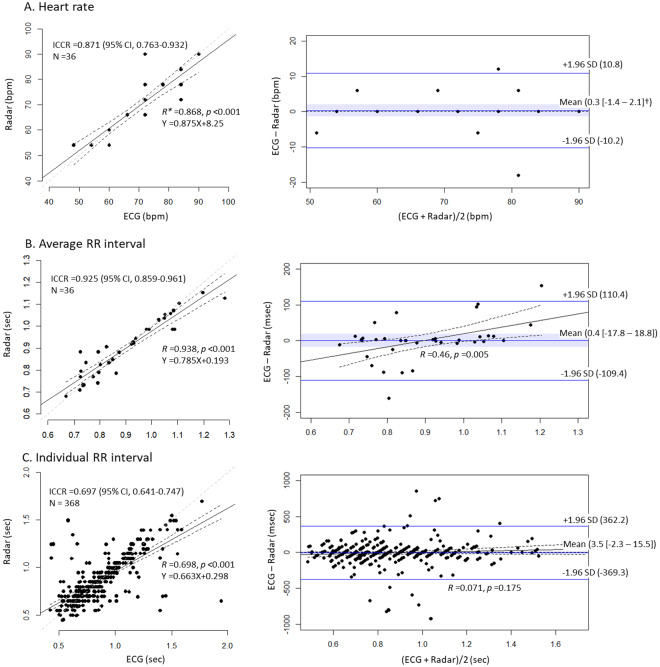
Figure 4.
Comparison of heart rate and RR intervals between ECG and the radar in patients with AF. Heart rate (A) and average RR interval (B) showed high agreement, while individual RR intervals (C) showed moderate agreement. The mean biases were not significant in any of the 3 parameters. There was a proportional difference in the average RR interval between ECG and radar. *All Rs were derived from Pearson’s correlation tests. †The blue ribbons and the numbers inside the brackets indicate 95% confidence intervals of the mean bias between ECG and radar measurements. ECG, electrocardiography; ICCR, intraclass correlation coefficient R; SD, standard deviation.

