Figure 6.
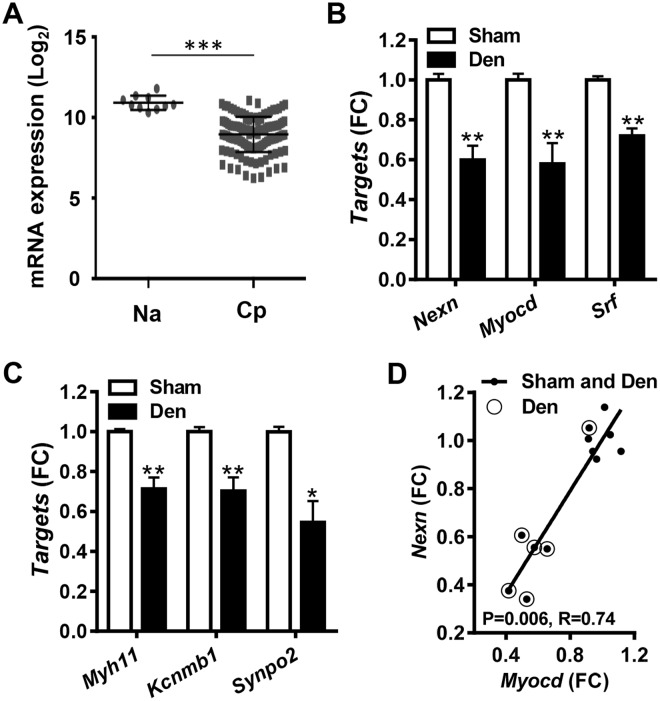
NEXN behaves like an SMC differentiation marker in vivo. Panel A shows the Log2 expression level of NEXN in normal human arteries (Na, N = 10) and carotid plaques (Cp, N = 127), respectively (data from the Bike database, see Materials and Methods). Panels B and C show expression of Nexn, Myocd and Srf (B) along with established SMC markers (C) following rat bladder denervation (N = 6 sham-operated control bladders, white bars, and N = 6 denervated bladders, black bars, see Materials and Methods for detail). Panel D shows that Myocd and Nexn correlate in the bladder dataset (P-value and Spearman Rho coefficient are given in graph).

