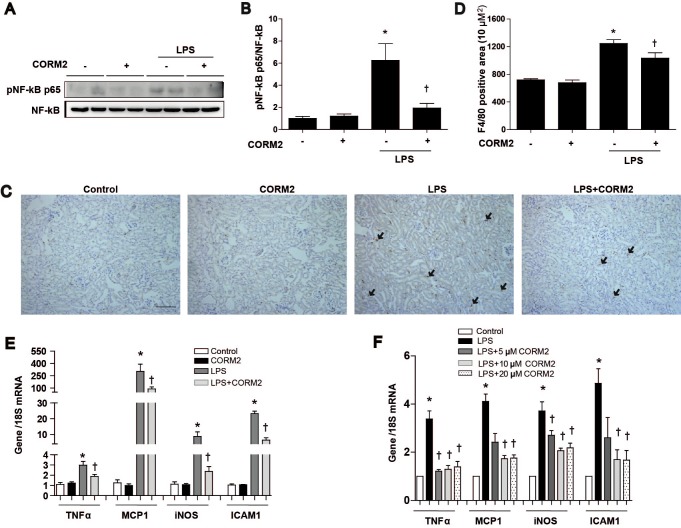
Fig. 2. CORM2 attenuates LPS-induced inflammation in kidney.
(A) pNF-κB protein expression in the kidney was measured using western blotting. (B) Band intensities were measured using ImageJ software. (C, D) Paraffin-embedded kidney sections were stained with anti-F4/80 antibodies (1:200; original magnification: 100×; scale bar: 100 µm), and arrow marks represents the macrophage infiltration. (E) The mRNA levels of inflammation markers such as TNFα, MCP1, iNOS, and ICAM1 in kidney tissue were measured using real-time PCR. Data are presented as means±SE of 5–8 mice/group; *p<0.05 vs. control, †p<0.05 vs. LPS. (F) The mRNA levels of inflammation markers such as TNFa, MCP1, iNOS, and ICAM1 in mProx cells were measured using real-time PCR. Data are presented as means±SE, n=4; *p<0.05 vs. control, †p<0.05 vs. LPS.

