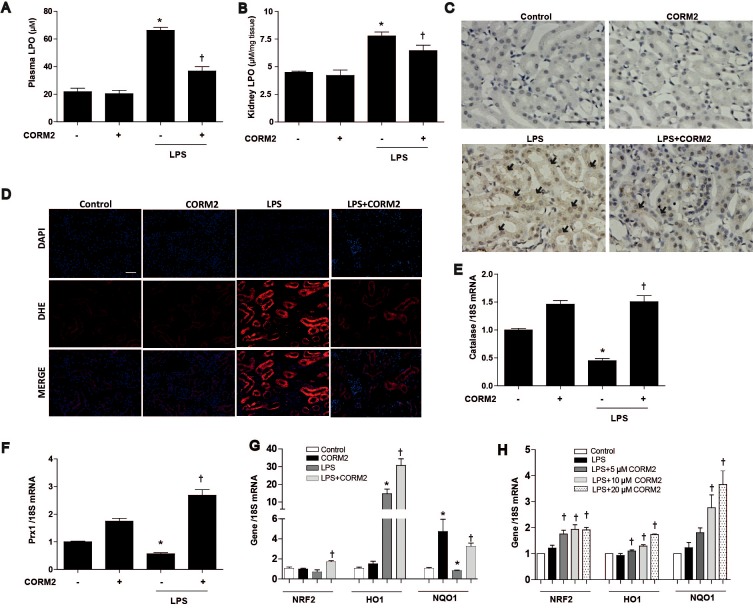
Fig. 4. CORM2 inhibits LPS-induced ER stress through suppression of ROS generation.
(A) Plasma LPO (µM), and (B) Kidney LPO (µM/mg tissue). (C) Paraffin-embedded kidney sections were stained with anti-nitrotyrosine antibodies (1:200; original magnification: 200×; scale bar: 100 µm), and arrow marks represents the accumulation of nitrotyrosine (brown color) on cytosol. (D) Frozen kidney sections were stained with DHE dye (5 µM for 10 min; original magnification: 100×; scale bar: 50 µm), and red color indicates the accumulation of ROS. The mRNA levels of antioxidant genes such as (E) Catalase, (F) Prx1, and (G) NRF2, HO1, and NQO1 in kidney tissue were measured using real-time PCR. (A–G) Data are presented as means±SE of 5–8 mice/group; *p<0.05 vs. control, †p<0.05 vs. LPS. (H) The mRNA levels of antioxidant genes such as NRF2, HO1, and NQO1 in mProx cells were measured using real-time PCR. Data are presented as means±SE, n=4; *p<0.05 vs. control, †p<0.05 vs. LPS.

