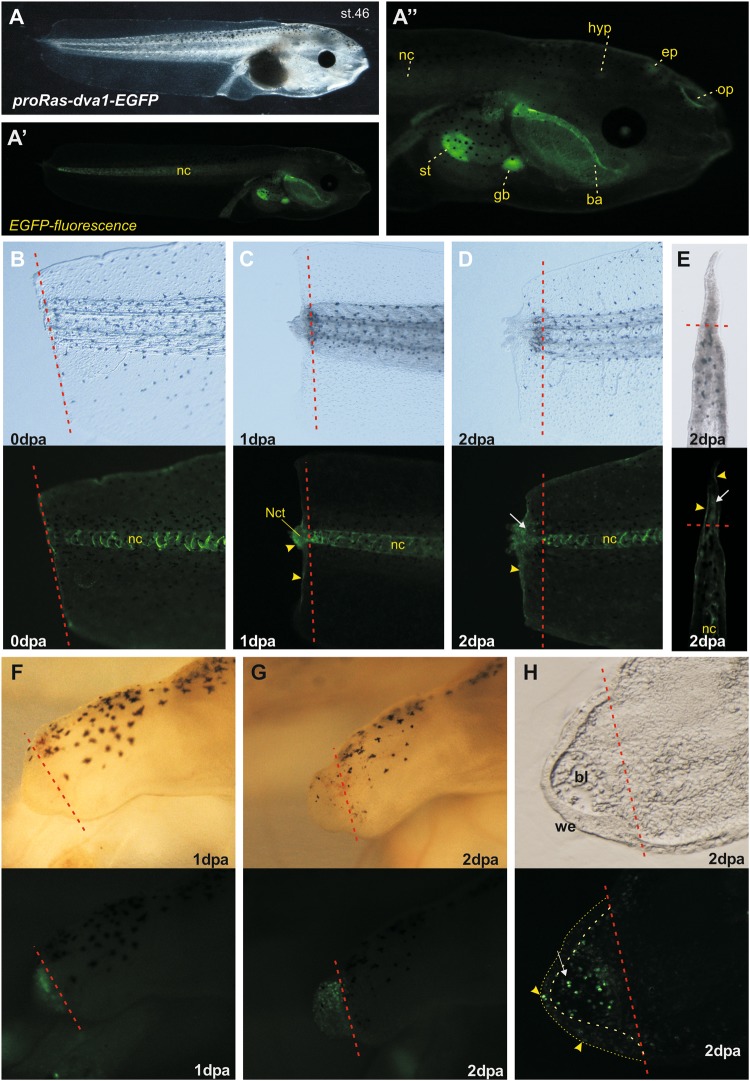
Figure 4.
Promoter activation analysis in transgenic tadpoles, expressing EGFP under the xRas-dva1 promoter control. (A,A’,A”) The transmitted light (A) and fluorescent (A’) images of whole transgene tadpole on stage 46 at 3 dpa, showing strong activity of xRas-dva1 promoter in the notochord, gut and the head. The enlarged fluorescent image of head region (A”) demonstrates the EGFP fluorescence in ba - branchial arches, ep- epiphysis, gb - gall-bladder, hyp – hypophysis, nc – notochord, op - olfactory pits, st – stomach. (B–E) The transmitted light and fluorescent images of proRas-dva1-EGFP tadpole’s st.42 tail tip just after amputation 0 dpa (B), at 1 dpa (C), at 2 dpa (D) and its sagittal section (E). (F–H) The transmitted light and fluorescent images of proRas-dva1-EGFP tadpole st.52 hindlimb bud at 1 dpa (F), at 2 dpa (G) and its sagittal cryosection (H). Red dashed line indicates the amputation level. The yellow arrowheads point on cells of wound epithelium. The white arrows point on blastema cells. The yellow dashed lines on H indicate wound epithelium borders.

