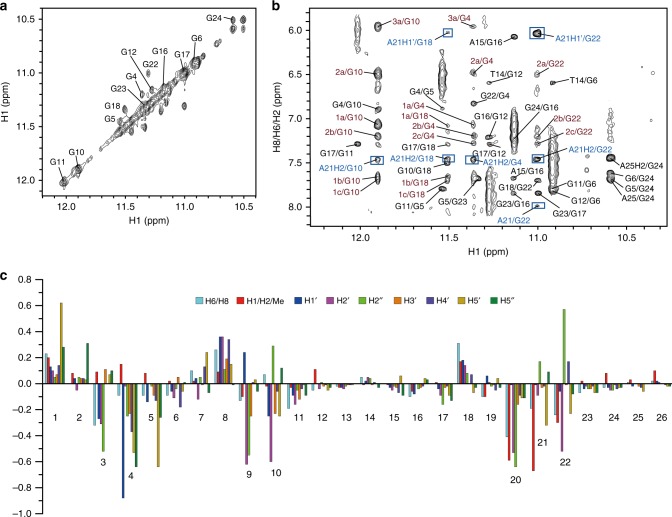
Fig. 3.
NMR spectra of the 1:1 Pt-tripod–Tel26 complex. a The expanded H1-H1 region of the NOESY at the 0.5:1 Pt-tripod/Tel26 ratio. Exchange cross-peaks between the free and bound Tel26 are labeled with residue numbers. b The expanded H1-H8/H6/H2 region of the 1:1 Pt-tripod–Tel26 complex. The GxH1-GyH8 cross-peaks of G-tetrads are colored in black. Inter-residue cross-peaks of A21 are framed and colored in blue. Intermolecular cross-peaks of the Pt-tripod and G-tetrad are colored in red. c The chemical shift difference of the protons between the free and bound Tel26 in the 1:1 complex. Condition: 100 mM K+, pH 7.0, 25 °C

