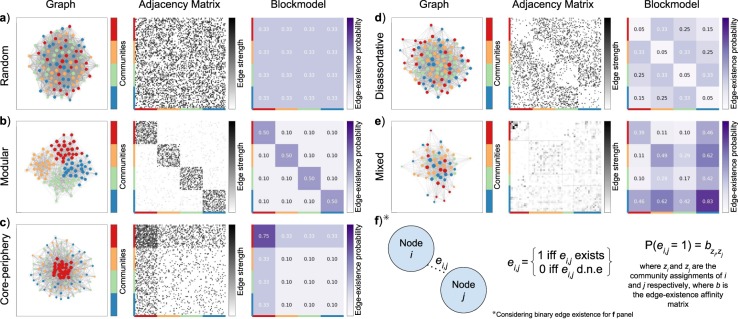
Figure 1.
Three representations of network data: graph, adjacency matrix, block model. The graph is visualized as a force-directed84 graph layout, the adjacency matrix is visualized as a square matrix with entries for each edge between nodes, and the block model is visualized as a square matrix with entries for each edge-existence parameter between communities. (a) Random network (b) Modular network (c) Core-periphery network (d) Disassortative network (e) Mixed network, based on an example fit to brain network data of a single hemisphere (f) An illustration of a binary (unweighted) edge for each network data representation.

