Fig. 1.
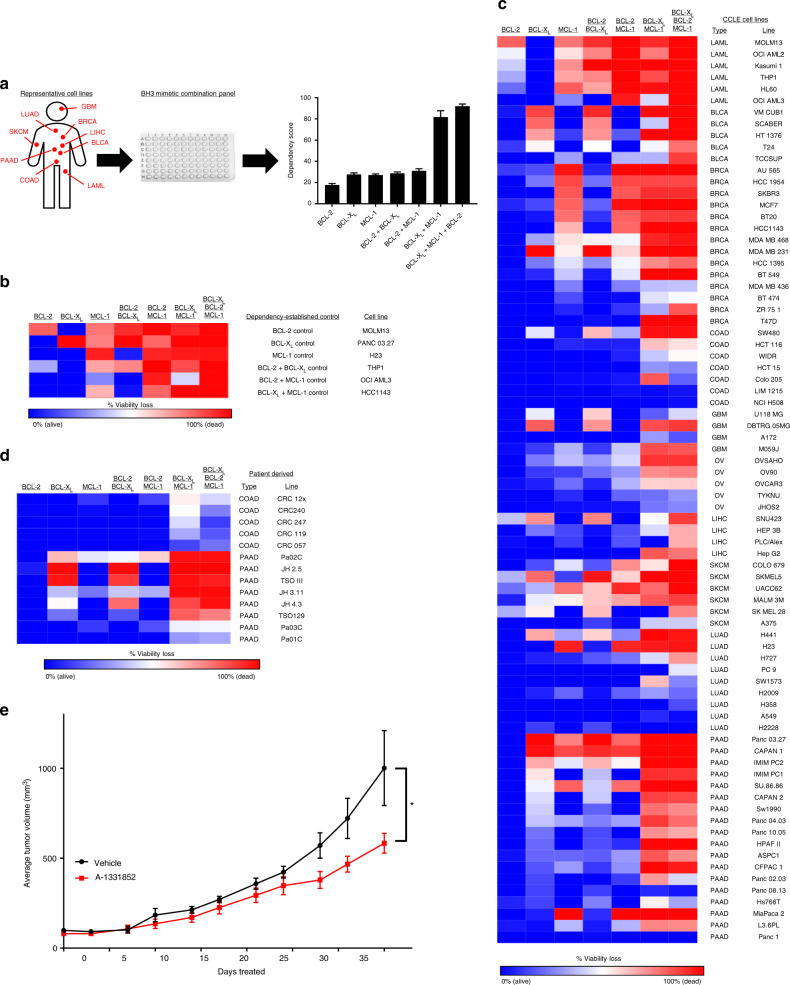
Systematic mapping of BCL-2 gene dependencies. a Workflow. Cell lines from 10 cancer types were treated with all combinations of the BCL-XL inhibitor WEHI-539 (1 µM), the BCL-2 inhibitor ABT-199 (1 µM), and/or the MCL-1 inhibitor A-1210477 (10 µM) for 3 days in a 96 well plate and assessed for changes in viability via Cell Titer-Glo (CTG). b A heatmap showing BCL-2 gene dependencies from six control cell lines that have known dependencies on: BCL-2 (MOLM13), BCL-XL (Panc 03.27), MCL-1 (H23), BCL-2 + BCL-XL (THP1), BCL-2 + MCL-1 (AML3), and BCL-XL + MCL-1 (HCC1143). Percentage viability loss is calculated as 100 – (the % viability signal determined from the CTG assay) and is colored from 0 % viability loss (blue) to 100 % viability loss (red). c Heatmap of BCL-2 gene dependencies in cell lines representing: acute myeloid leukemia (LAML), high-grade serous ovarian carcinoma (OV), colorectal adenocarcinoma (COAD), pancreatic ductal adenocarcinoma (PAAD), non-small cell lung carcinoma (LUAD), melanoma (SKCM), liver (LIHC), bladder (BLCA), breast (BRCA), glioblastoma (GBM). d Patient-derived cell lines from COAD or PAAD tumors were assayed for BCL-2 gene dependencies. e An in vivo xenograft model of JH4.3 cells grown in athymic mice. Once tumors reached 100 mm3, mice (6-7 per group) were treated with vehicle or the BCL-XL inhibitor A-1331853 (25 mg/kg, qd) until the vehicle group reached 1000 mm3 (35 days). A 2-way ANOVA between vehicle (n = 5) and treated (n = 7) groups yielded a significant p-value (*, p = 0.005)

