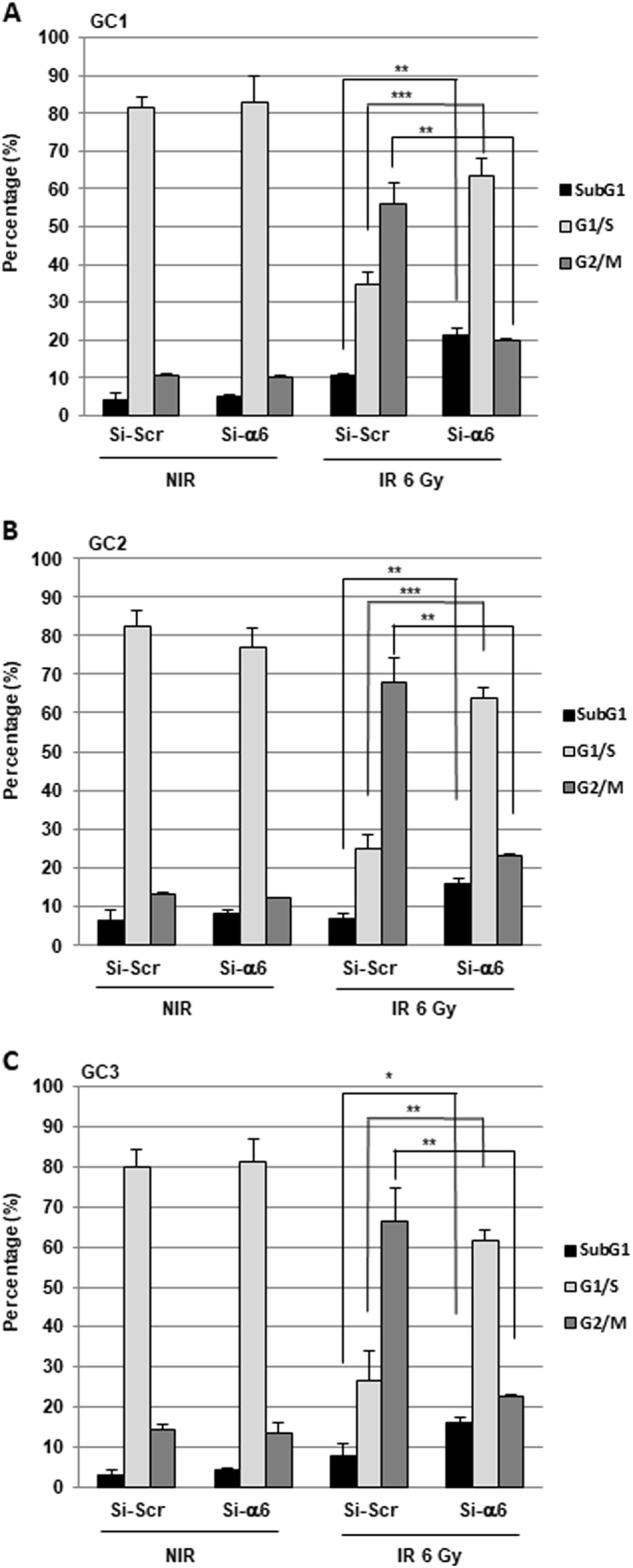
Fig. 3. Cell cycle analysis.

Cells derived from three GBM biopsy specimens (GC1, GC2 and GC3) were transfected with an α6-integrin siRNA (si-α6) or a scramble control (si-Scr). Forty-eight hours post-irradiation (6 Gy), propidium iodide staining was performed as described in “Materials and methods section” and the DNA content was analyzed by flow cytometry. Percentage of cells in sub-G1, G1/S and G2/M phases were quantified by the BD Accuri C6 software. Quantifications of three experiments are presented as means ± SD. ***p < 0.001; **0.001 < p < 0.01; *0.01 < p < 0.05.
