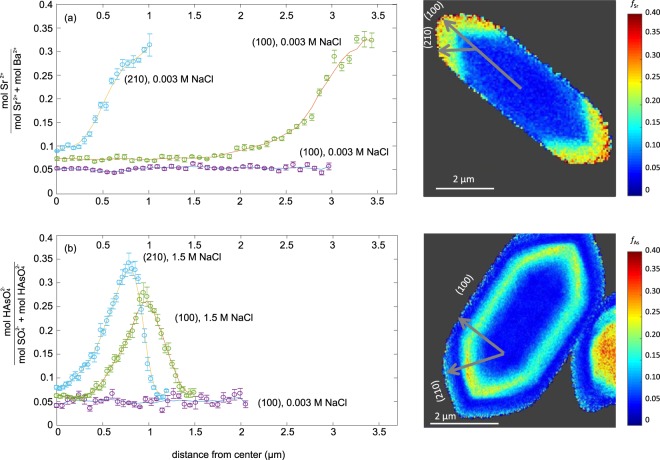
Figure 5.
Profile plots of the fractional substitution of (a) Sr2+ in a selected particle from the (Ba,Sr)SO4 experiments, and (b) HAsO42− in a selected particle from the Ba(SO4,HAsO4) experiments along the transects corresponding to crystal growth directions indicated in the fractional substitution maps on the right for particles from experiments at high salinities. The growth directions for experiments at low salinity are indicated in Fig. 1b,d.

