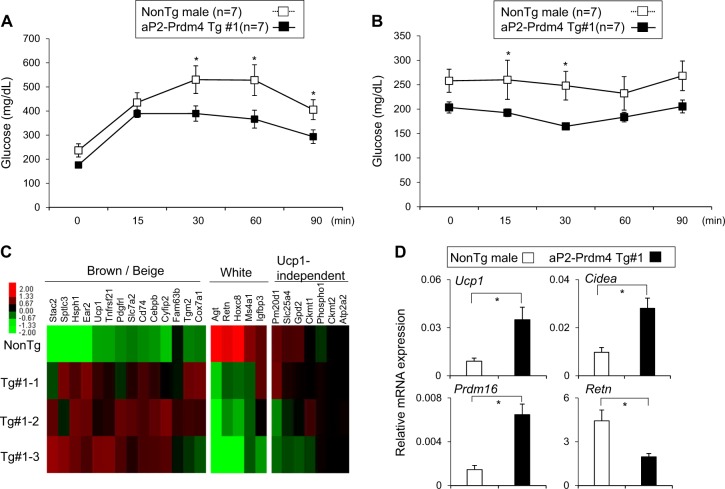
Fig. 5. aP2-Prdm4 Tg mice improve glucose homeostasis and induce thermogenic program.
a Glucose tolerance test and b insulin tolerance test in control NonTg (n = 7) and aP2-Prdm4 Tg group (n = 7). HFD-fed mice were fasted for 6 h before intraperitoneal injection of glucose (1 g/kg) or insulin (0.5 U/kg) for GTT and ITT experiments, respectively. Tail blood samples were collected at different time points to measure blood glucose levels. c Heat maps of relative expression levels of brown or beige-selective, white-selective, and Ucp1-independent genes in iWAT of aP2-Prdm4 Tg and NonTg mice. d Expression analysis of selected brown genes (Ucp1, Cidea, and Prdm16) and white adipocyte-selective gene (Retn) in iWAT of NonTg and aP2-Prdm4 Tg mice. Gene expression was determined by real-time PCR. Data were normalized to 36b4 and expressed as mean ± s.e.m. statistically significant differences in gene expression data were determined by Student’s t-test and two-way ANOVA was used to determine significance in GTT and ITT. *P < 0.05

