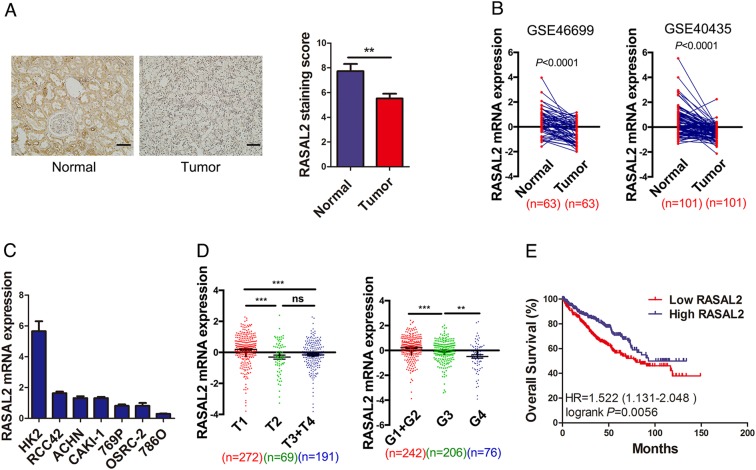
Fig. 1. Expression of RSAL2 in RCC tissues and cell lines.
a Immunohistochemistry staining of RASAL2 in normal kidney tissues (n = 18) and RCC tissues (n = 47). The scale bar is 40 µm. b RASAL2 mRNA expression in normal kidney tissues and matched RCC tissues from GEO database (GSE46699 and GSE40435). c Real-time quantitative PCR of RASAL2 mRNA expression in human RCC cell lines. d RASAL2 mRNA expression in human RCC tissues with different stages (T) and grades (g) from TCGA. e Kaplan–Meier analysis (long-rank test) of overall survival of RCC patients with high (n = 266) or low (n = 266) RASAL2 mRNA expression from TCGA. **P < 0.01, ***P < 0.001, ns no significant

