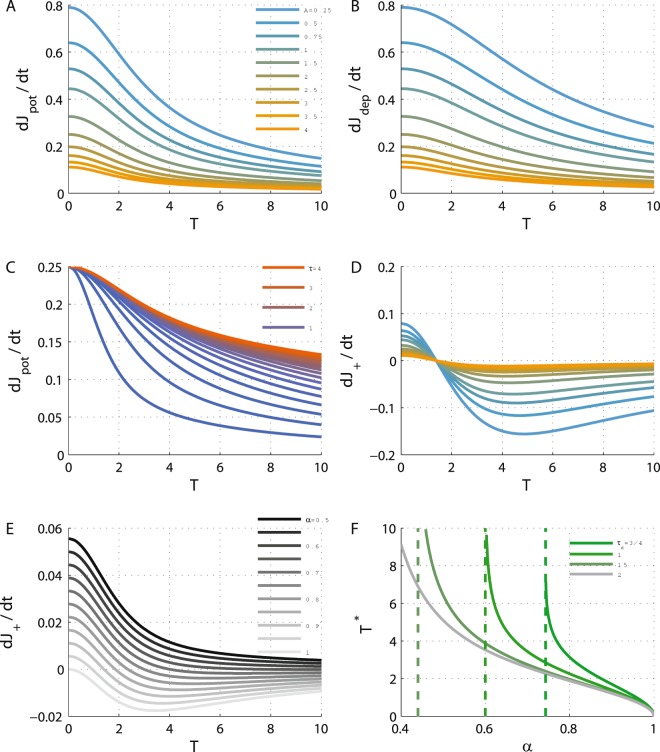
Figure 2.
The dynamics of J+ along the diagonal. (A) The potentiation term, , of the mean synaptic weights, J+, Eq. (16), is shown as a function of the oscillation period along the diagonal for different values of A = 1/4, 1/2, 3/4, 1, 3/2, … 4 (from top at low A values to bottom). (B) The depression term, , of the mean synaptic weights, J+, Eq. (16), is shown as a function of the oscillation period along the diagonal for different values of the adaptation strength, A (as in A). (C) The effect of the STDP time constant. The potentiation term, , is shown as a function of the oscillation period along the diagonal for different values of τ+ = 1/4, 1/5, … 5, by different colors from blue (low τ+) to red. Here A = 2 was used. (D) The J+ dynamics along the diagonal. The value of is shown as a function of the oscillation period along the diagonal for different values of A using the same values and color code as in A, using α = 0.9. (E) The effect of the relative strength of depression. The value of is plotted as a function of the oscillation period along the diagonal for different values of α = 0.5, 0.55, … 1 from top (α = 0.5) to bottom (with A = 4). (F) Oscillation period at the STDP fixed point. The ‘learned’ oscillation period, T*, is shown as a function of α for different values of τ− differentiated by color. The vertical dashed lines depict the value of αc, see calculation of αc section in Methods. In all panels I = 2 was used, and λ = 1 was taken in D and E, for purposes of illustration. Unless otherwise stated, τ+ = 0.5 and τ− = 1 used. All units of time were measured in units of τa.

