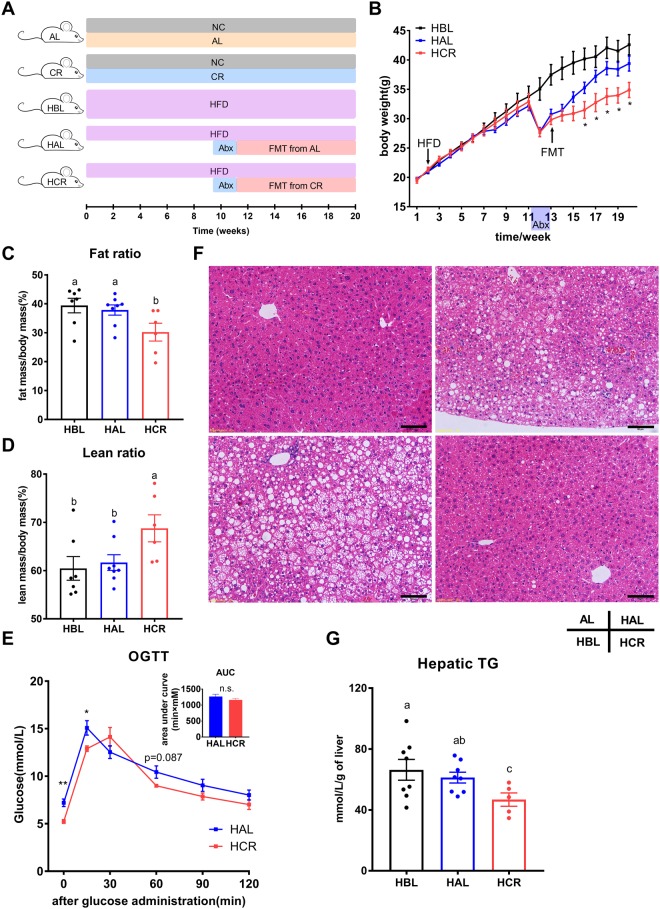
Figure 6.
FMT from CR mice attenuated diet-induced obesity and partially ameliorated metabolic disturbances. (A) Schematic design of the FMT experiment. NC, normal chow; HFD, high fat diet. (B) Body weight curves of mice fed HFD (n = 6–8 per group). (C,D) Quantification of body fat mass (C) and lean mass (D) by MRI scans (n = 6–8 per group). (E) Oral glucose tolerance test of mice received FMT (n = 6–8 per group) with area under curve (AUC) shown in the inlet. (F) Representative H&E staining of the liver. Scale bar, 50 μm. (G) Hepatic triglyceride levels of the mice fed HFD (n = 6–8 per group). Data are expressed as means ± s.e.m, *p < 0.05, **p < 0.01.

