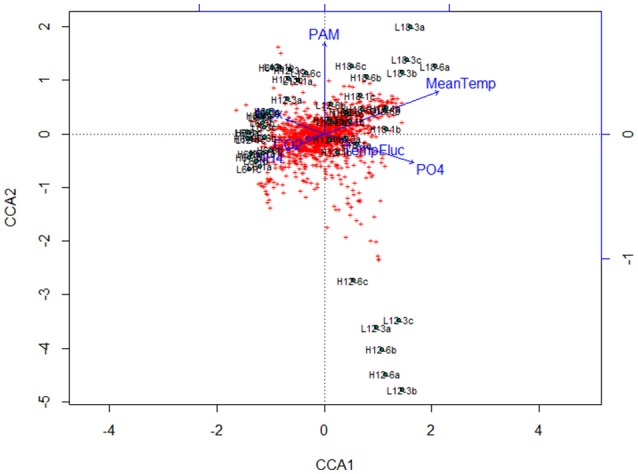
Figure 4.

Canonical Correspondence Analysis (CCA) plot for major bacterial species (comprising >1% of the total bacterial community composition of each sample) at species level (OTU) resolution. The blue lines and labels correspond to the environmental conditions and nutrient concentrations, and the black labels represent the individual treatments.
