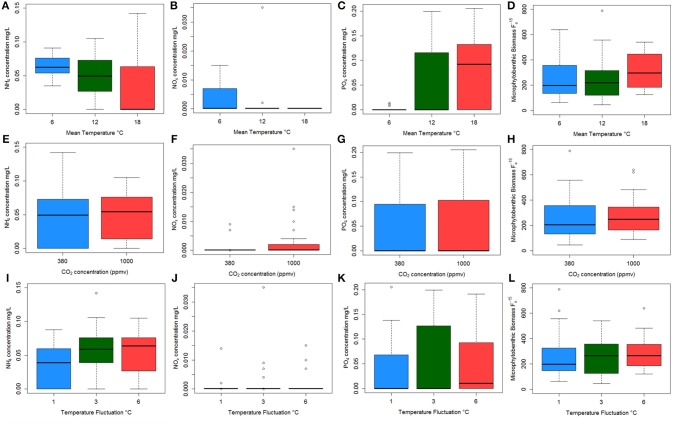
Figure 5.
Boxplots showing the raw data for each nutrient concentration (A–I) and microphytobenthos (MPB) biomass (J–L) against each environmental: NH4 concentration (A,E,I); NOx concentration (B,F,J); PO4 concentration (C,G,K) and MPB biomass (D,H,L) against mean temperature (top plots); CO2 regime (middle plots); and temperature fluctuation (bottom plots). Colors indicate mean temperature treatments of 6°C (blue), 12°C (green), and 18°C (red) in the top three graphs; represent CO2 levels of 380 ppmv (blue) and 1,000 ppmv (red) in the middle plots; and temperature fluctuation of 1°C (blue), 3°C (green), and 6°C (red).

