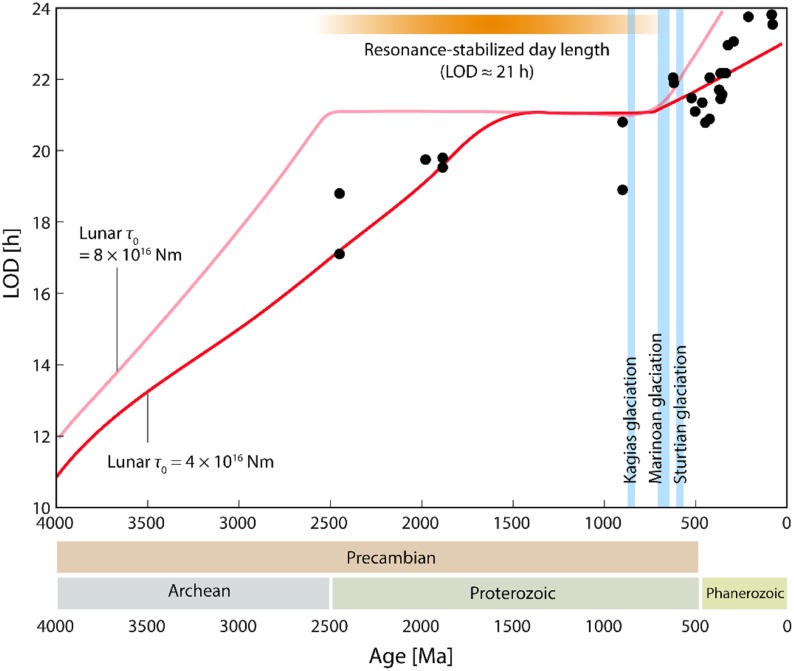
FIGURE 3.
Changes of LOD over a period of 4000 million years (Ma). Black dots represent empirically determined LOD values based given by Williams. The two red functions represent different predictions of the long-term LOD changes by Bartlett and Stevenson based on varying choices of τ0, the lunar torque. Only the prediction based on the upper and lower range of τ0 values used for the simulation are shown for clarity.

