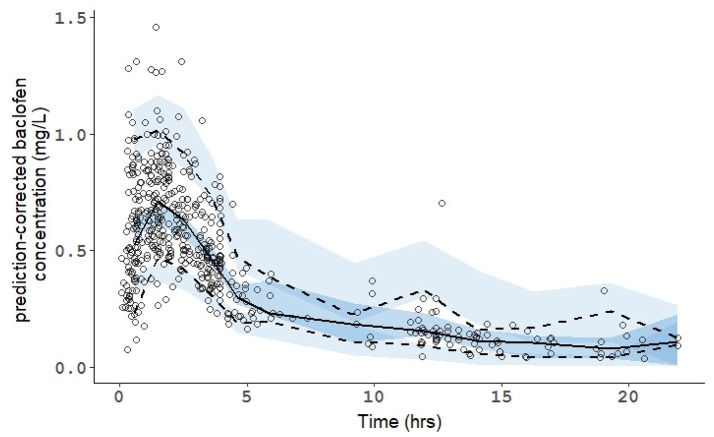
Figure 2.
Prediction-Corrected Visual Predictive Check (pcVPC) of the population pharmacokinetic model for the racemic mixture of baclofen. The line and the dashed lines are the observed percentiles (50, 5, and 95th percentiles). The shaded fields represent a simulation-based 95% confidence interval for the 5, 50, and 95th percentiles. The observed plasma concentration (prediction corrected) are presented by circles.

