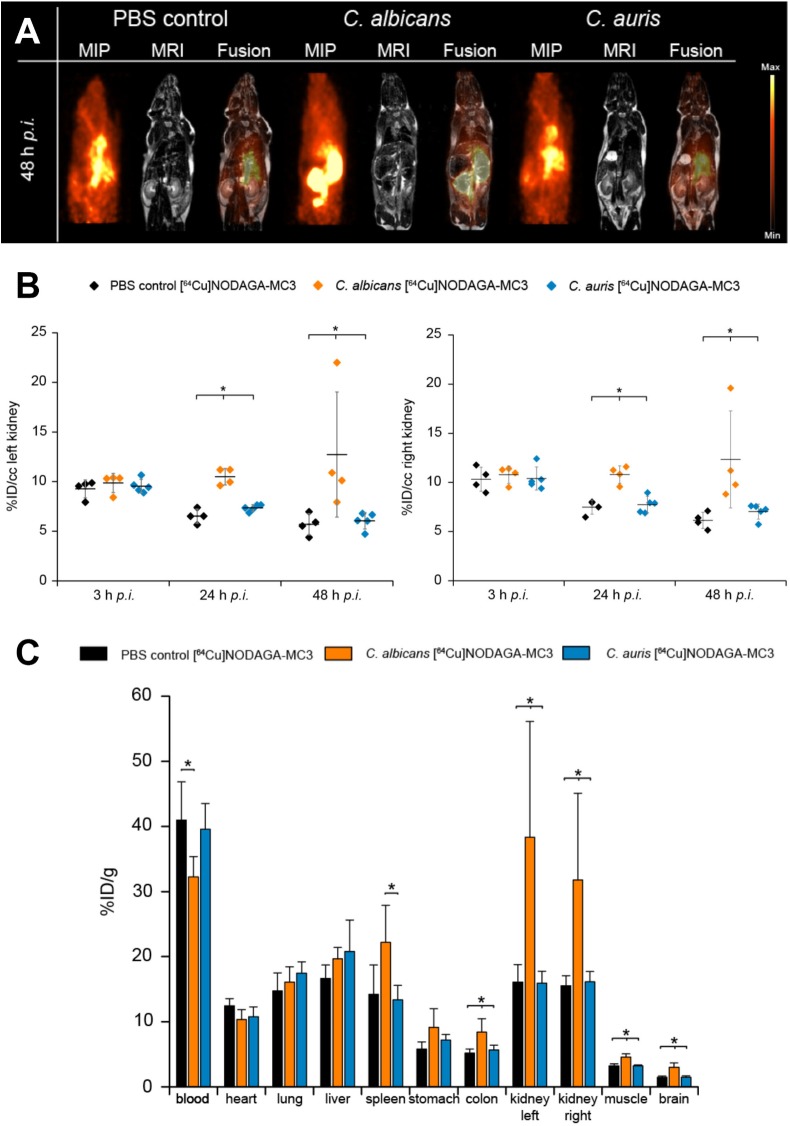
FIGURE 3.
(A) In vivo biodistribution of [64Cu]NODAGA-MC3 in PET/MR imaging at 48 h p.i. Coronal Maximum Intensity Projection (MIP), MR and fused PET/MR images of PBS-treated (control) mice, and C. albicans-infected and C. auris-infected mice injected with the tracer. The acquired images reveal specific uptake of the tracer in the left and right kidneys of C. albicans-infected mice, but not in the kidneys of PBS-treated (control) mice. The specificity of the tracer was further demonstrated using a strain of C. auris which, while reactive with MC3 in vitro using ELISA (Figure 1), was non-infective in the i.v. challenge model. Here, uptake of the tracer in the kidneys was similar to the uptake found in the PBS control mice. (B) Quantification of the PET images for the left and right kidneys of the three different groups of mice at 3, 24, and 48 h p.i. Significantly higher uptake of the [64Cu]NODAGA-MC3 tracer is seen in the left and right kidneys of C. albicans-infected mice compared to PBS-treated (control) and C. auris-infected animals at 24 and 48 h p.i. Data are expressed as mean ± SD %ID/cc. Group differences were examined using one-way ANOVA, followed by post hoc Tukey–Kramer, with significant differences at ∗p < 0.05. (C) Ex vivo biodistribution at 48 h p.i. Significantly higher uptake of the [64Cu]NODAGA-MC3 tracer in the left and right kidneys of C. albicans-infected mice, compared to the kidneys of corresponding PBS-treated (control) and C. auris-infected animals, confirms the PET/MR imaging and in vivo biodistribution data at 48 h p.i. In addition to increased uptake of the tracer in the kidneys, significantly higher uptake was also shown in the colons, muscles, and brains of C. albicans-infected mice compared to C. auris-infected and PBS-treated mice, significantly higher uptake in the spleens of C. albicans-infected mice compared to C. auris-infected mice, but significantly reduced uptake in the blood of C. albicans-infected mice compared to PBS-treated (control) animals. Data are the results of N = 4–5 animals per group and expressed as the mean ± SD %ID/g.

