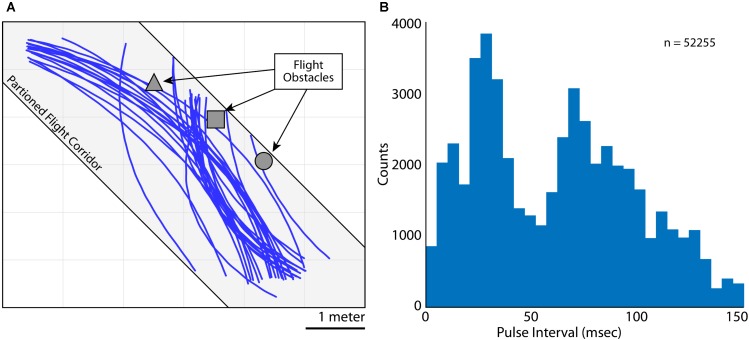
FIGURE 2.
Flight and vocal behaviors. (A) 2D (X and Y) flight trajectories for Bat 3 during one experimental session. Flight paths are shown in blue, flight obstacles are shown in gray. The flight room was partitioned into a narrow corridor (gray shading, 6 m × 2 m × 3 m) to restrict the bat’s flight paths. (B) Distribution of pulse intervals (PIs) during all recording sessions for Bat 3. Note the bimodality of the distribution, indicating vocalizations emitted at a high rate (i.e., short PI’s) and lower rate (i.e., longer PI’s).

