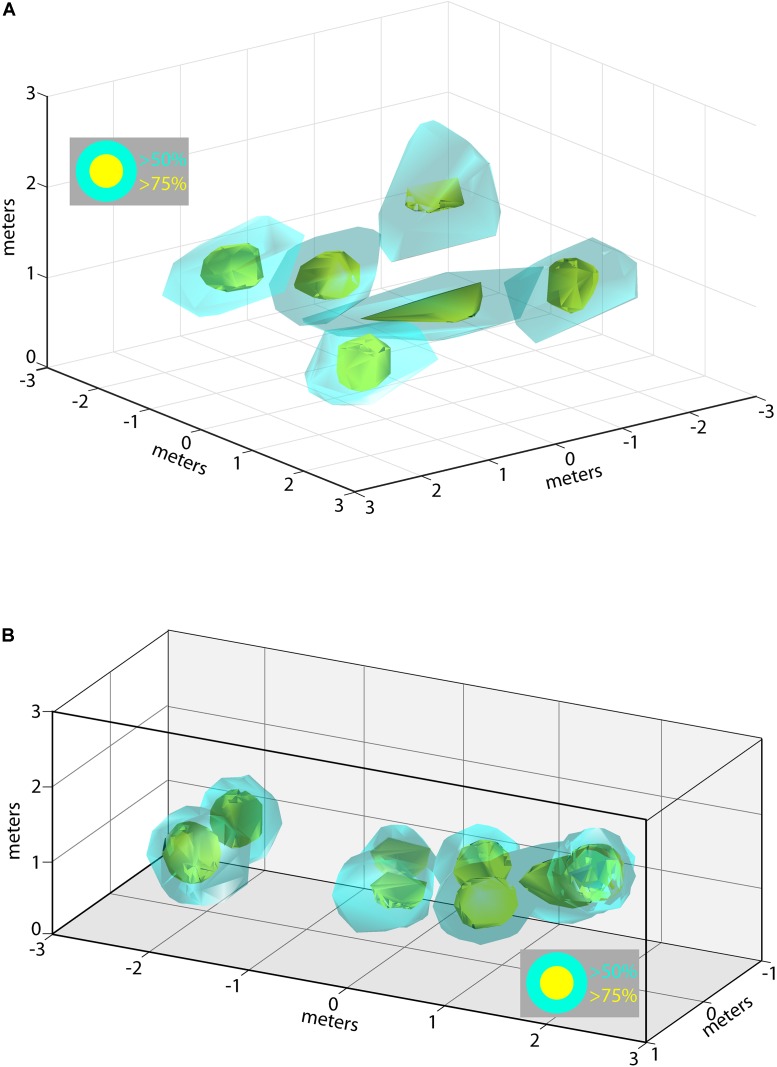
FIGURE 6.
Composite of 3D place fields in one recording session. (A) Locations of 3D place fields for six different neurons recorded during one experimental session for Bat 2. Yellow clouds indicate the boundaries of spatial locations eliciting firing rates greater than 75% of the maximum firing rate; cyan indicates locations eliciting firing rates greater than 50% of the maximum rate. (B) Locations of 3D place fields for eight different neurons recorded during one experimental session for Bat 3. Note that the flight paths for Bat 3 were restricted to a narrow corridor. Colors as in (A).

