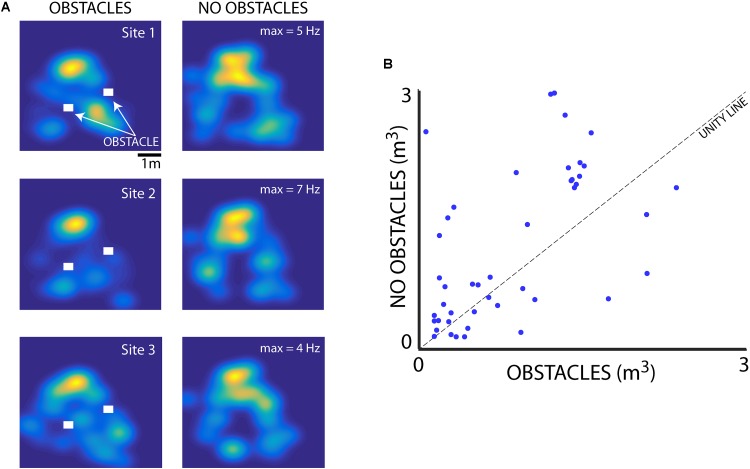
FIGURE 7.
Effect of flight obstacles on place field size. (A) Left column, XY heat maps of firing rates for three different neurons recorded in Bat 2 in the presence of 3D flight obstacles in the experimental test room. Obstacles are shown as white rectangles. Right column, the activity of the same three neurons as shown in left column, but when the obstacles were removed from the room. Maximum firing rates for each neuron are shown on the right column heat maps. (B) Comparison of place field size (m3) for neurons in the presence and absence of flight obstacles for Bat 1 and Bat 2. Place fields are significantly smaller in the presence of obstacles than when obstacles are absent (n = 49, p = 0.019, rank-sum test).

