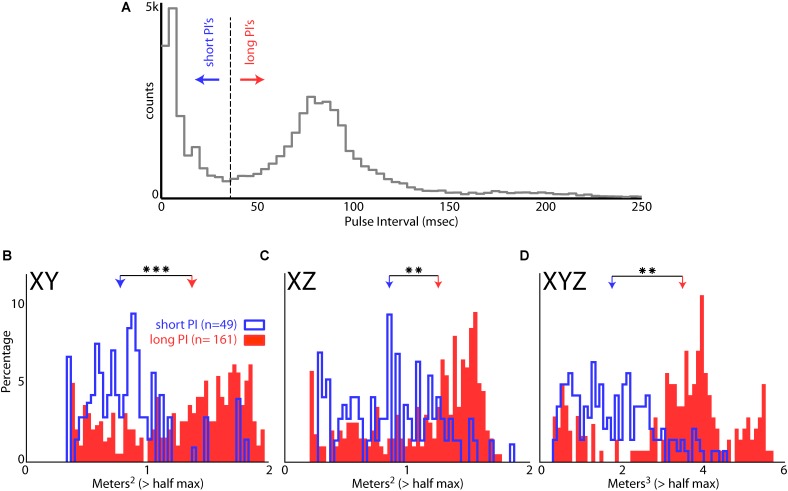
FIGURE 8.
Effect of vocal rate on place field size. (A) Distribution of pulse intervals (PIs) for Bat 1 and Bat 2. Note the bimodality of the distribution, with the minima between modes falling at a PI of 35 ms. (B) Size of place fields in the XY dimension (defined as m2 greater than the half of the maximum firing rate) when the bats were emitting vocalizations at a short PI (blue, less than 35 ms PI’s, n = 49 neurons), and when the bats were emitting vocalizations at a longer PI (red, greater than 35 ms PI’s, n = 161 neurons). There is a significant decrease in place field size when the bats are emitting vocalizations at a short PI (p = 6.54e-12, two-tailed t-test; arrows indicate mean values). Right, comparison of mean place field size when the bat was producing vocalizations at a short PI (left, blue) and long PI (right, red) vocalizations. (C) Size of place fields in the XZ dimension when the bats were emitting vocalizations at a short PI (blue), and long PI’s (red). There is a significant decrease in place field size when the bats are emitting vocalizations at a short PI (p = 3.54e-6, two-tailed t-test). (D) Size of place fields in the XYZ dimensions when the bats were emitting vocalizations at a short PI (blue), and long PI’s (red). There is a significant decrease in place field size when the bats are emitting vocalizations at a short PI (p = 1.72e-8, two-tailed t-test). ∗∗ indicates p < 1e-5, ∗∗∗ indicates p < 1e-10.

