. 2018 Jul 23;9(32):6605–6613. doi: 10.1039/c8sc02752h

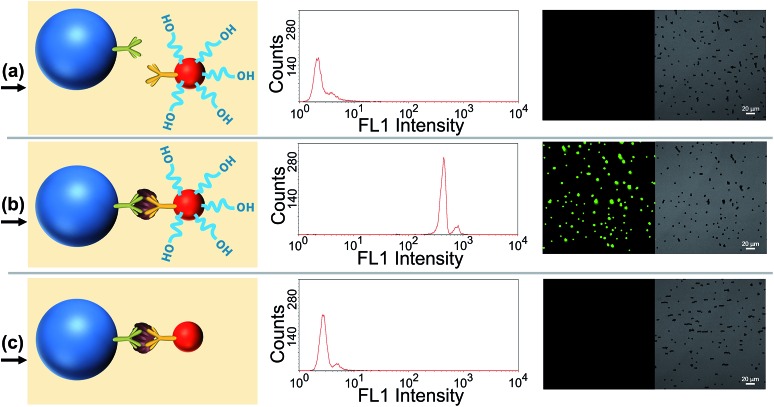
Fig. 2. (a) FCM result and the corresponding fluorescence image of the MBs involved in the TdT-FCI system without the PSA target (blank control); (b) FCM result and the corresponding fluorescence image of the MBs involved in the TdT-FCI system in the presence of 20 ng mL–1 PSA target. In images (a) and (b), the TdT-FCI is conducted following the standard procedures as stated in the Experimental section; (c) FCM result and corresponding fluorescence image of the MBs involved in the TdT-FCI system with 20 ng mL–1 PSA target by using mAb2–AuNPs instead of mAb2–AuNPs–ODN. All of the parameters for the FCM measurement and fluorescence imaging are the same in (a–c). Acquisition parameters of the fluorescence images: HV, 520 V; gain, 1; offset, 20%; collected fluorescence band, 500–600 nm.

Fig. 2