. 2018 Jul 23;9(32):6605–6613. doi: 10.1039/c8sc02752h

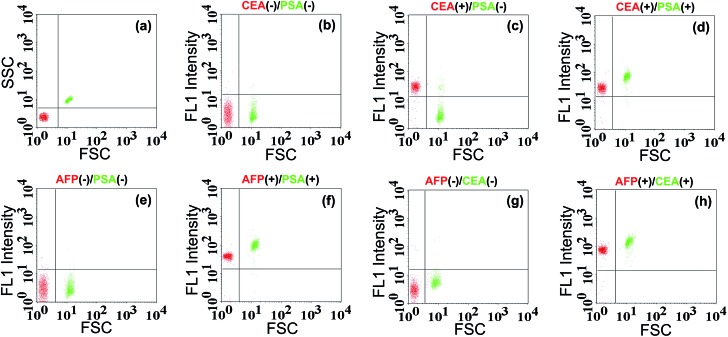
Fig. 8. The results for simultaneous detection of two antigens by using the bead size-coded TdT-FCI strategy. (a) Scatter plot (FSC vs. SSC) of the bead mixture containing both 1 μm Myone MBs (red color) and 2.8 μm M-270 MBs (green color). (b)–(h) The size-coded scatter plots (FL1 vs. FSC) of the bead mixture treated with different target components (the target combinations are clearly indicated). 10 ng mL–1 AFP, 4 ng mL–1 PSA and 3 ng mL–1 of CEA are used in this study because such values are the recognized detection thresholds for clinical diagnosis, respectively. Other experimental conditions: TdT, 1 U; dTTP, 1 mM; FAM-poly(A)25, 5 μM.

Fig. 8