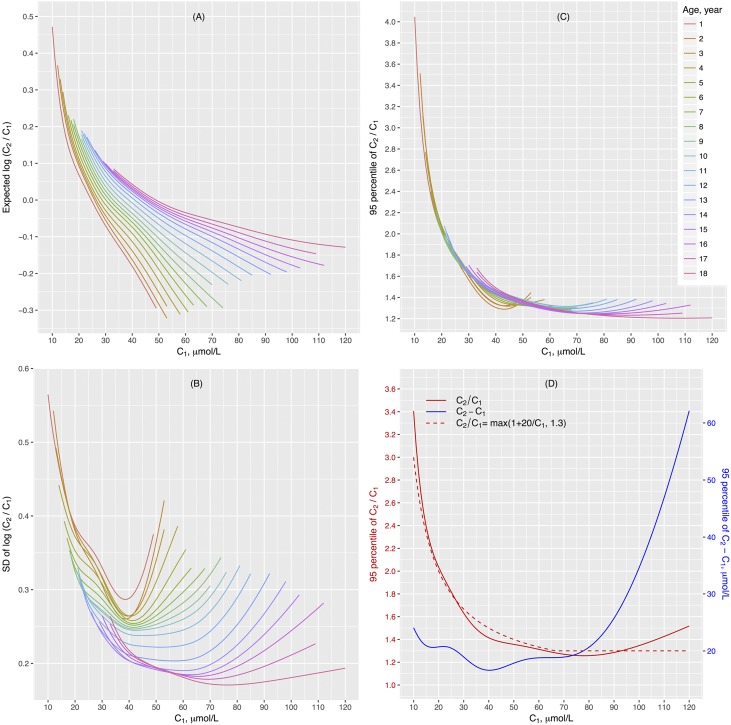
Figure 2.
Distribution and the reference change value (RCV) of serum creatinine (SCr). (A) The mean and (B) SD of log SCr ratio (c2/c1) given age and initial SCr values estimated in 100,081 children who had at least two SCr measurements (c1 and c2 in sequential order) within 30 days and did not have kidney diseases or known risks of AKI. We assumed log(c2/c1) to be normally distributed with a mean of μ and a variance of σ2 given age and c1, and we used Gaussian location-scale additive models to estimate the distribution parameters μ and σ2 as a function of age and c1. (C) The estimated 95th percentile of SCr ratio given age and initial creatinine value. The curves were remarkably similar across the age spectrum. (D) The smooth curves of 95th percentile of SCr ratio (red solid line) and the corresponding absolute change in creatinine (also known as RCV; blue solid line) given initial creatinine value. The dotted red line is the SCr ratio given by the formula max(1+20/c1, 1.3), with the corresponding SCr change (c2−c1) being max(20 μmol/L, 0.3×c1), where c1 is in units of micromoles per liter. The formula approximates the empirical curve (red solid line) well.

