Figure 1.
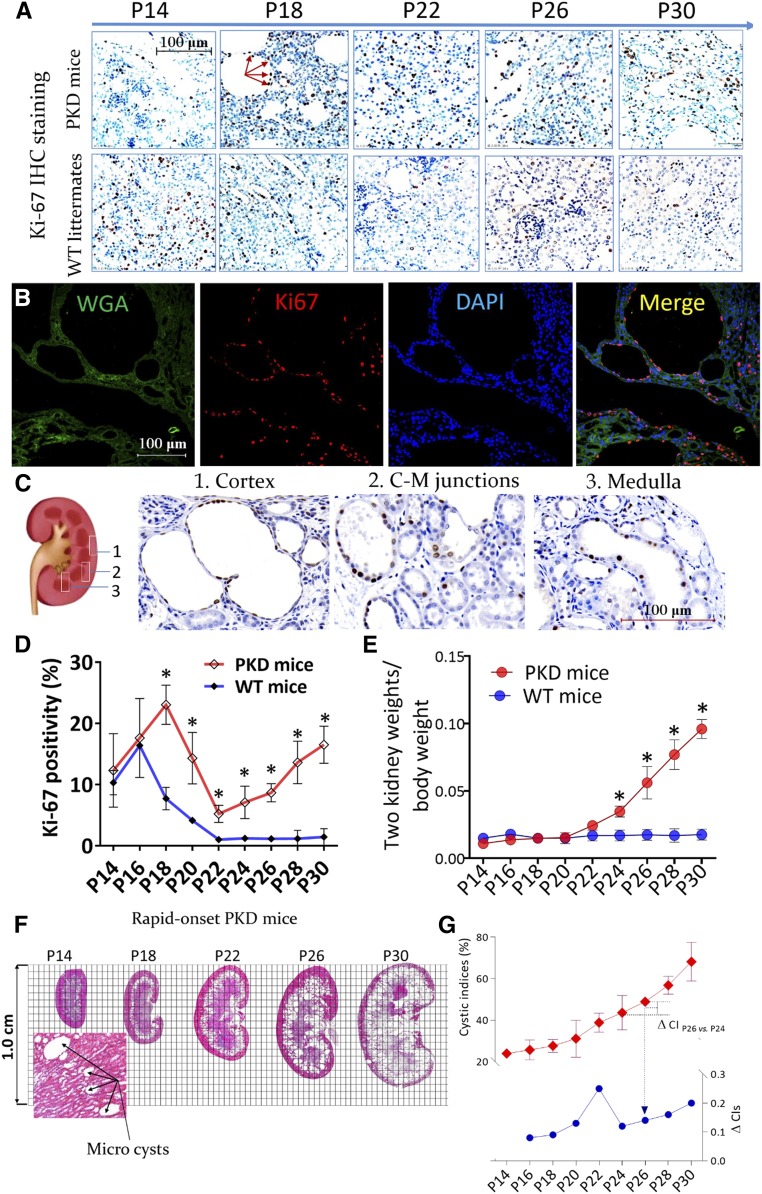
Cell proliferation in the kidney tissues of mice with PKD. (A) Polycystic kidney and age-matched WT kidney sections were stained with Ki-67 (red arrows, ×400). (B) Multichannel immunofluorescence colocalization of Ki-67 (red), fluorescein wheat germ agglutinin (WGA; green, to illuminate the tubular structures), and DAPI (blue) in P30 polycystic kidney sections, ×400. (C) The distribution of proliferative cells in polycystic kidney tissues at P30, as shown by Ki-67 IHC staining, ×600. (D and E) Comparison of the (D) proliferative indices (percentage of positive nuclei stained by Ki-67) and (E) 2KW/BW ratios between PKD mice and WT littermates; *P<0.05. (F) Whole kidney section scans after hematoxylin and eosin staining. Microcysts formed at P14. (G) CIs (red trace, shown on left y axis) and the change in CI (ΔCI, blue trace, shown on right y axis) of polycystic kidneys at different postnatal ages. Data are presented as means±SDs of five or six mice at different postnatal ages. C-M, cortico-medullary; vs, versus.

