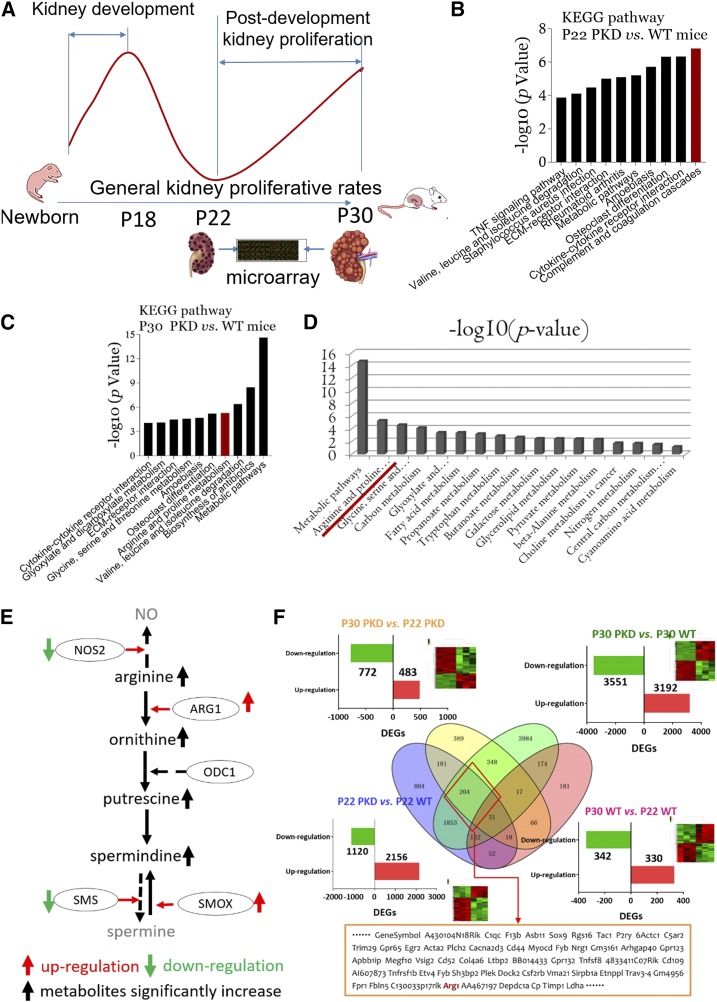
Figure 2.
Arginine-polyamine pathway is activated in late-stage polycystic kidneys. (A) Kidney specimens from P22 and P30 PKD mice and age-matched WT littermates were collected and microarrays were used to compare DEGs and to analyze significantly activated signaling pathways (Kyoto Encyclopedia of Genes and Genomes [KEGG] pathway analyses). P22 and P30 were the starting point and peak, respectively, of the second proliferative index of polycystic kidneys. (B) KEGG signaling pathway analyses of kidney tissues from P22 PKD mice versus WT littermates. (C) KEGG signaling pathway analyses of kidney tissues from P30 PKD mice versus WT littermates. (D) Many metabolic pathways were significantly activated in kidney tissues from P30 PKD mice versus WT littermates; arginine metabolism was the leading activated pathway. (E) Substrate, enzymes, and metabolites of the arginine-polyamine pathway. Red up arrow, upregulation; green down arrow, downregulation; black up arrow, significantly increased metabolite production; solid line, activated pathway; dashed line, inactivated pathway. (F) Multi-pool comparison of kidney DEGs: Pool-1, P30 versus P22 PKD mice (yellow circle); Pool-2, P22 PKD mice versus WT littermates (blue circle); Pool-3, P30 PKD mice versus WT littermates (green circle); Pool-4, P30 versus P22 WT mice (red circle). In total, 204 DEGs were expressed specifically in P30 polycystic kidneys. Arg1 was included in the 204 DEGs. vs, versus.

