. 2018 Jun 4;9(31):6572–6579. doi: 10.1039/c8sc00803e

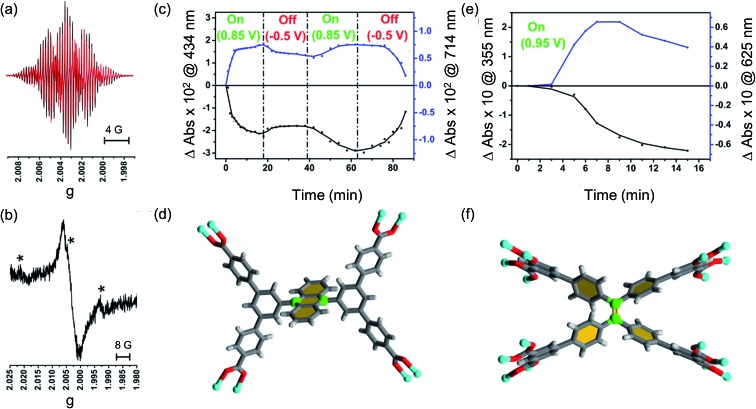
Fig. 6. EPR spectra of (a) oxidised Et4L1 (black trace: experimental, red trace: simulated) and (b) oxidized film of MFM-186. The mark ‘*’ denotes a possible impurity from NO from the reduction of NOBF4. The time-dependent changes in UV-Vis absorbance for (c) thin film of MFM-186 and (e) thin film of MFM-180 recorded as a response towards electrochemical oxidation at ambient temperature at specific potentials. Black traces in both cases indicates, π–π* transitions of neutral species whereas blue traces show changes in π–π* transitions of oxidized species. Also shown coordinating environment of the ligand (d) [Et4L1]4– and (f) [Et8L2]8–. Two carbon atoms for a possible site of the nucleophilic attack have been highlighted in green. Colour code: C: dark grey, H: light grey, Cu: blue, O: red. Note; in case of (d) two carbon atoms for nucleophilic attack are more sterically crowded.

Fig. 6