. 2018 Jul 11;9(30):6348–6360. doi: 10.1039/c8sc02000k

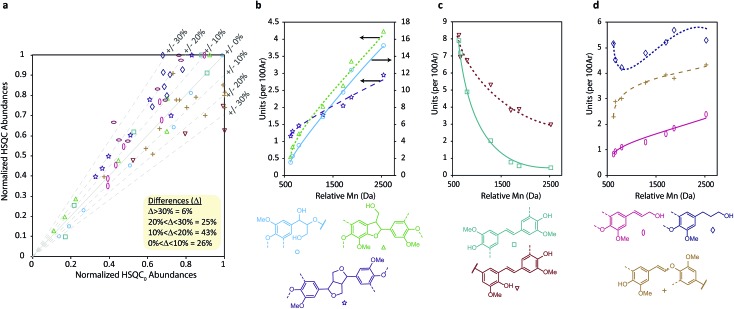
Fig. 4. (a) Comparison of normalized lignin unit values across the fractions obtained from HSQC and HSQC0 experiments demonstrating the correlation between the two techniques. Points are color coded to match individual units and each point represents a matched pair of HSQC and HSQC0 measurements. Data was normalised relative to the largest abundance value for each linkage. (b) Abundances of native linkages, (c) kraft-derived stilbenes and (d) lignin end units in the different molecular weight lignin samples obtained from solvent fractionation of Indulin AT Kraft lignin. Lines have been added only to highlight trends and are not regression lines.

Fig. 4